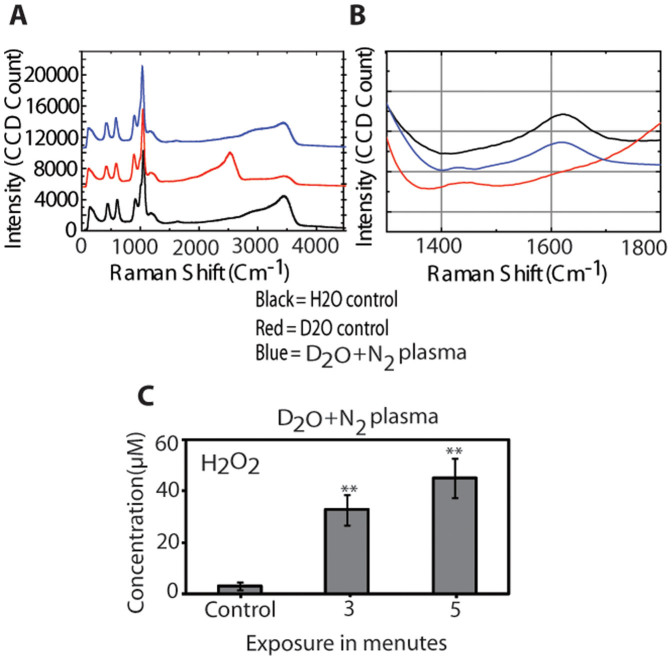
Figure 3.
(a) Raman spectra of the H2O (black), D2O (red), D2O + N2 plasma (blue) after binding with titanyl ion after 5 min; (b) Raman spectra of the H2O (black), D2O (red), D2O + N2 plasma (blue) after binding with titanyl ion to check the conformation of D2O2; (c) Determination of H2O2 concentration in 1 ml water solution after D2O + N2plasma exposure for 3 and 5 min. All values are expressed as ± SD in triplicates. Students' t-test was performed to control (* denotes P<0.05 and ** denotes P<0.01).

