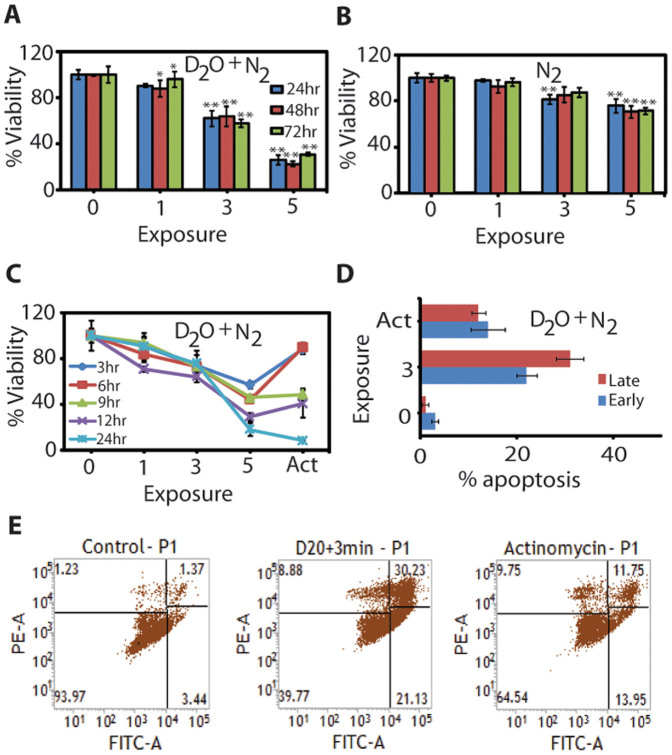
Figure 4.
Viability of G361 cells treated with (A) D2O + N2 plasma; (B) N2 plasma (C) cell viability during different time intervals after plasma treatment with D2O + N2 plasma. Viability of plasma treated cells was measured after 3, 6, 9, 12 and 24 h incubation by MTT assay; (D) Early and late apoptosis analysis through flow cytometry after Annexin V-FITC/PI staining of plasma treated G361cells; (E) The normalized cell number distribution to Annexin V-FITC/PI intensity of G361 cells was plotted by plasma exposure time. Actinomycin D was used to make positive control. All values are expressed as ± SD in triplicates. Students' t-test was performed to control (* denotes P<0.05 and ** denotes P<0.01).

