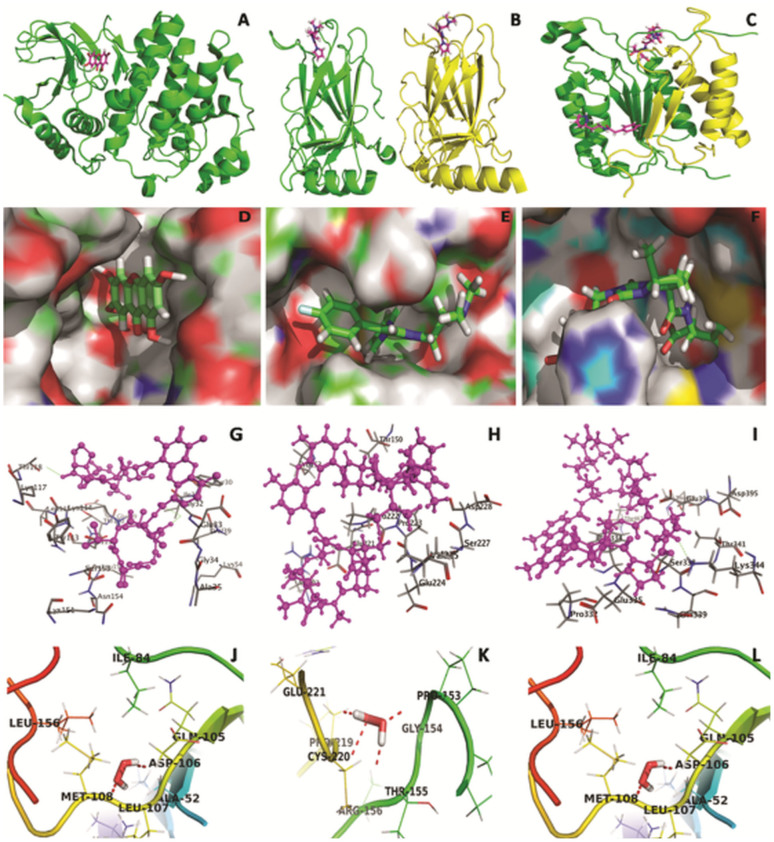
Figure 8.
Backbone ribbon diagram of the Erk2 (A), p53 (B) and caspase-8 (C) heterodimer. Inhibitors are shown as in magnatacolor. Electrostatic potential mapped onto molecular surface for substrate binding-site (active pocket) of Erk2 (D), p53 (E) and caspase-8 (F). Inhibitors are shown as in green color in binding pocket site. In silico molecular docking studies elucidating the interaction of actinomycin D in the binding site of Erk2 (G), p53 (H) and Caspase-8 (I) protein. H2O2/D2O2 docked on target with total docking score 3.4751 (J), 3.7161 (K) and 2.6876 (L) show two H-bond of length 1.9 and 1.9 Å to binding pocket residue ASP-106 and MET-108, with Erk2, four H-bond of length 1.8,1.8, 1.9 and 2.0 Å to binding pocket residue GLY-154, THR-155, CYS-220 and GLU-221 with p53 and two H-bond of 2.1 Å to binding pocket residue GLU-396 with caspase-8 within selection radius of 4Å from bound substrate revealing the binding site pocket of active conformation.

