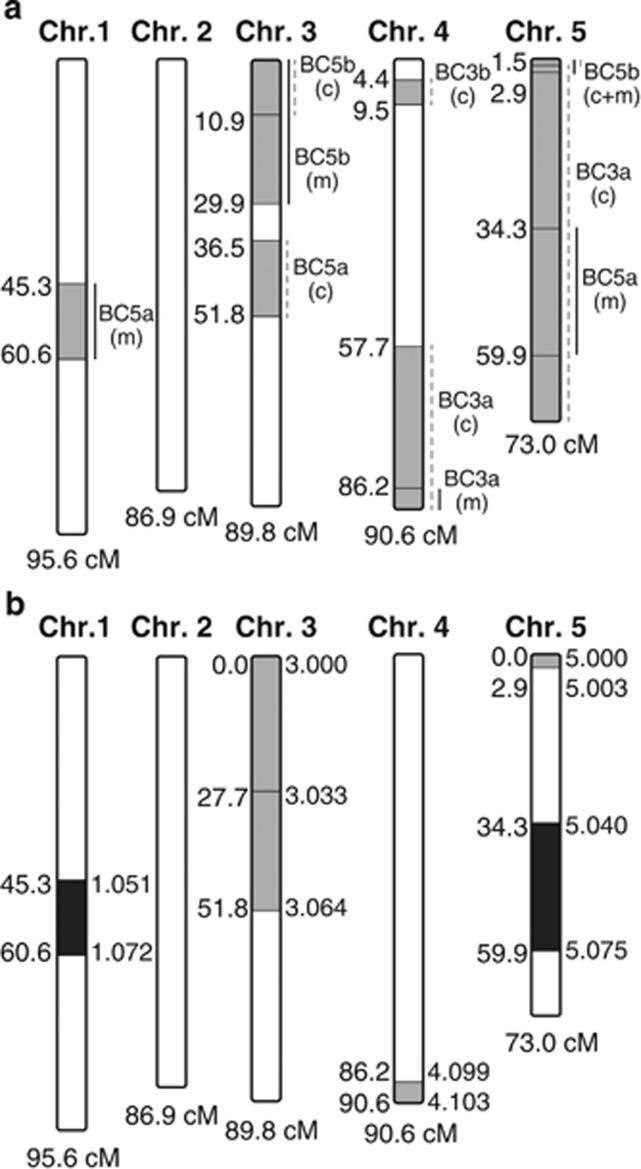
Figure 2.
Potential memory retention QTLs. (a) Multiple heterozygous regions were detected by genotyping microarray in the four pairs of samples (BC3a, BC3b, BC5a and BC5b). The grey sections show the location of these heterozygous regions on each of the five chromosomes of Nasonia, which is also given in cM on the left. The lines on the right of each section show the size of the introgressed region in each of the samples (m—decreased long-lasting memory, black lines; c—control, dashed grey lines). (b) A total of six introgression lines were generated to test the effects of individual QTLs on memory retention. The grey sections indicate the location of these regions on the chromosomes of Nasonia, the location is given in cM on the left of each region and the marker cluster on the linkage map of Desjardins et al. (2013) is given on the right. The two dark grey regions affect memory retention, whereas the light grey regions did not.

