
Figure 1. Morphology and membrane currents of microglia and macrophages/monocytes.
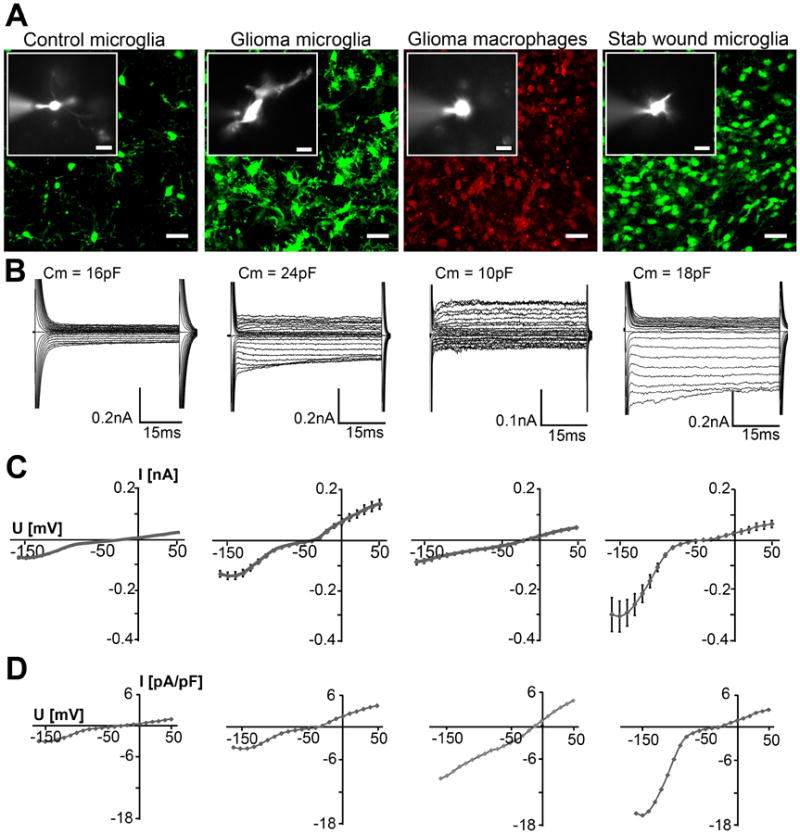
(A) Fluorescent images of eGFP and RFP illustrate the typical ramified morphology of control microglia in unlesioned brain, the amoeboid morphology of GAMs, the round morphology of GAMPs and the morphology in stab wound microglia; scale: 20μm. Small inserted images show a recorded cell dialyzed with SR101; scale: 10μm. (B) Membrane currents from the cells shown in (A), recorded in response to de- and hyperpolarizing voltage steps from -160mV to +50mV for 50ms at a holding potential of -70mV. (C) I-V plots of average currents from all recordings obtained from control microglia, GAMs, GAMPs and stab wound-associated microglia. (D) The mean I-V curves normalized for cell capacitance (Current Density [pA/pF]) are displayed for each group.