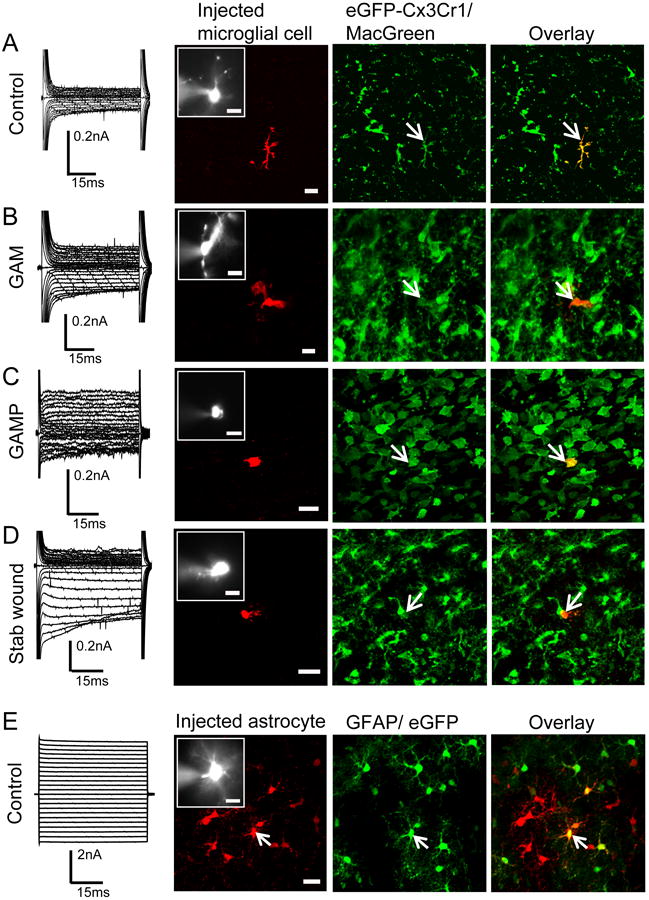
Figure 3. Lack of coupling of microglia and macrophages/monocytes.

Membrane currents (recorded as described in Fig.1) of a control microglia (A), GAM (B), GAMP (C) a stab wound microglia (D) and an astrocyte are shown on the left. The second column shows the biocytin staining, the third the eGFP-fluorescence (MacGreen mouse (A-D); GFAP/eGFP mouse (E)), the overlay is given in the fourth column, scale: 20μm. The insert in the second column is a magnification of the recorded cell dialyzed with SR101; scale: 10μm. Arrows indicate the injected cell.
