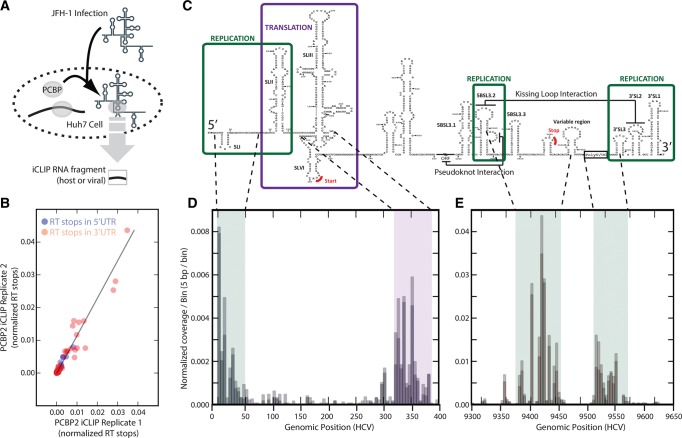
FIGURE 4.
Systematic mapping of PCBP2 iCLIP data to the JFH-1 HCV genome. (A) Experimental design to identify in vivo PCBP2 interaction sites across the JFH-1 HCV genome. (B) Genomic structural features within both UTRs with functional annotation. (C) Scatter plot of individual RT stops mapping to the JFH-1 genome comparing the two iCLIP biological replicates. (D,E) Coverage histogram across the 5′ UTR revealing peaks at SL1, across the SL1-SLII junction, and around the start codon (D) and across the 3′ UTR revealing peaks on hairpins involved in the kissing interaction as well as the poly-U/C tract (E). Both coverage histograms include bin size of 5 bp.

