FIGURE 3.
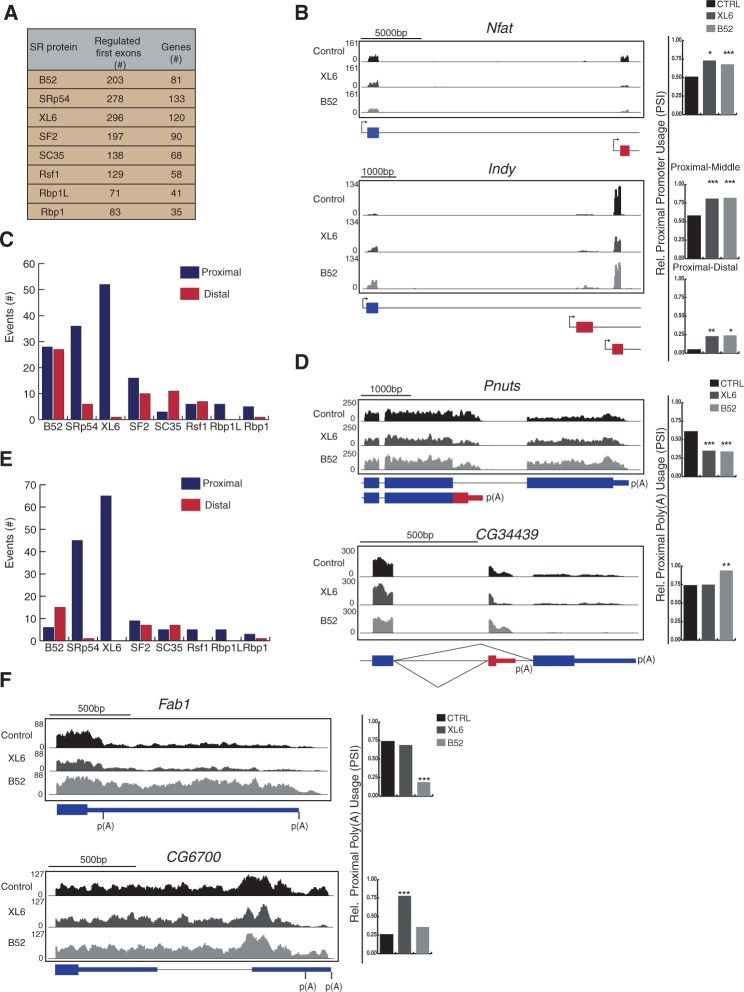
SR proteins regulate promoter choice and 3′ end processing. Transcripts with alternative promoter and polyadenylation sites were analyzed for changes when individual SR proteins are depleted (Fig. 1). (A) Total number of transcripts with differential promoter selection when individual SR proteins are knocked down. (B) RNA-seq tracks for representative transcripts with altered promoters. Shaded gray regions above the gene model correspond to the density of mapped RNA-seq reads from each sample. Charts on the right indicate the relative frequency of proximal promoter usage (PSI; significantly changed events [*] P ≤ 0.05, [**] P ≤ 0.01, [***] P ≤ 0.001 Fisher's exact test). (C,E) Number of altered events within transcripts with CR-APA sites (C) and UTR-APA sites (E), subdivided into shifts to proximal or distal polyadenylation sites. (D,F) RNA-seq tracks for representative transcripts with CR-APA (D) and UTR-APA (F) (blue boxes, constitutive regions; red boxes, alternative regions and poly(A) sites; thin lines, 3′ UTR). Shaded gray regions above the gene model correspond to the density of mapped RNA-seq reads from each sample. Charts on the right indicate the relative frequency of proximal APA usage (PSI; significantly changed events [***] P ≤ 0.001 Fisher's exact test).

