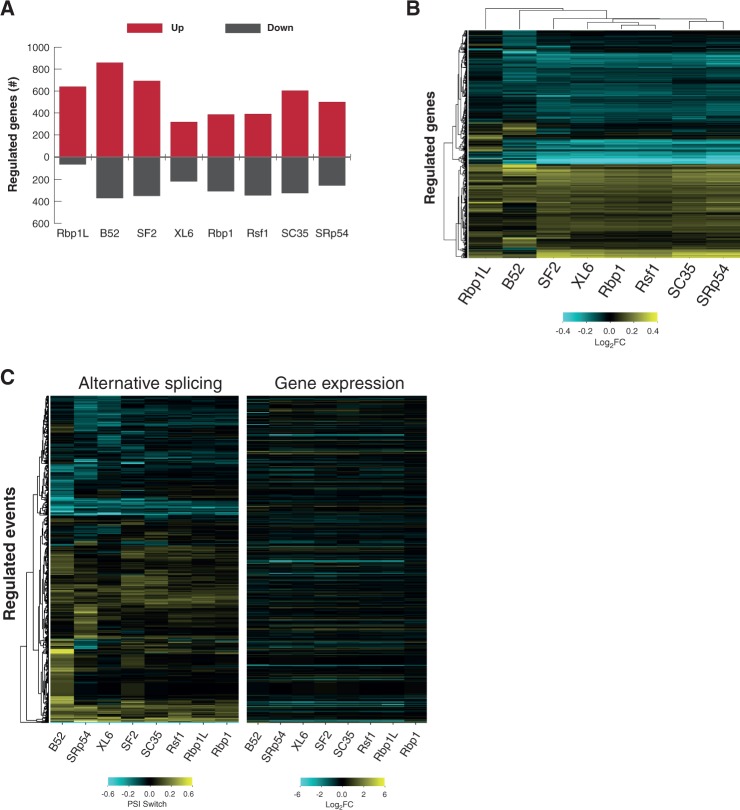
FIGURE 4.
SR proteins regulate RNA transcript levels. Transcript abundance was calculated and normalized for control and SR-depleted RNA-seq samples (Fig. 1). (A) Number of genes with differential expression (red, increased; dark gray, decreased). (B) Heatmap showing hierarchical clustering of calculated fold-change (log2) for genes with significantly altered transcript levels. (C) Heatmaps comparing identified AS-regulated events (Fig. 1D) (left) and their corresponding gene expression changes (fold-change [log2]) (right).

