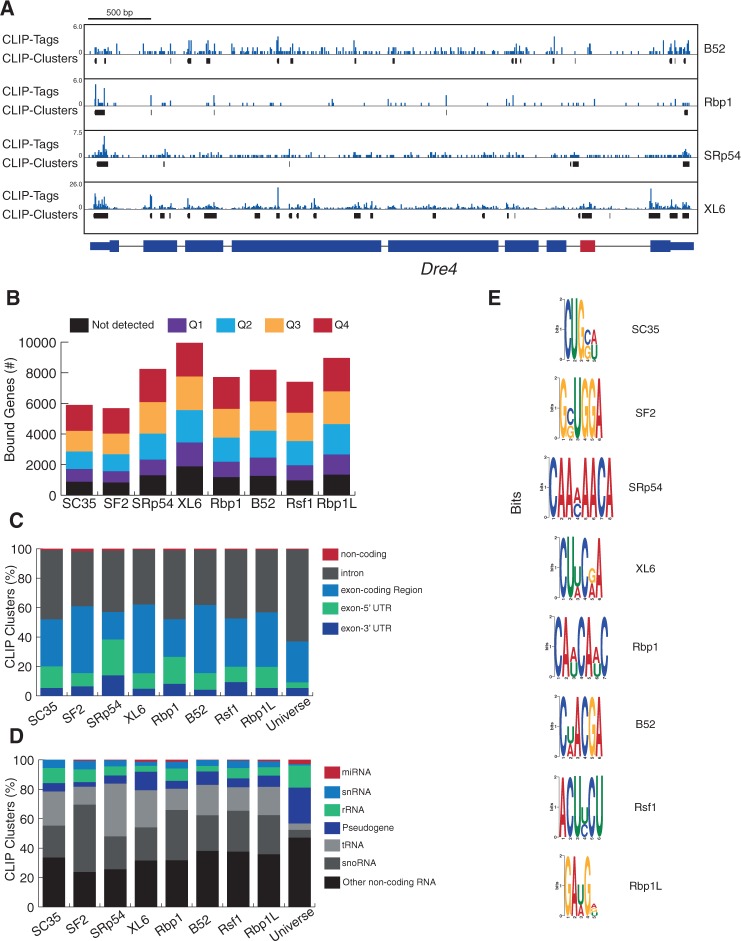
FIGURE 6.
Global landscape of RNA transcripts bound by SR proteins. (A) Dre4 gene (alternatively spliced exon is red) displaying density of CLIP tags (blue) and CLIP clusters (black) for four representative SR proteins across the transcript. (B) Number of genes that contain at least one SR protein CLIP cluster, grouped by gene expression level—ranging from “not detected” (below RNA-seq detection levels) to Q4, the highest level of expression. (C,D) Proportion of CLIP clusters that mapped to five different regions on SR-protein-bound transcripts (C) and common types of noncoding RNA for each SR protein (D); Universe, reference showing the proportion of genomic space for each feature. (E) Graphical representation of consensus-binding motifs derived for each SR protein. Height indicates the information content at each position of the binding motif in bits (log-odds in base 2).

