
Figure 6.
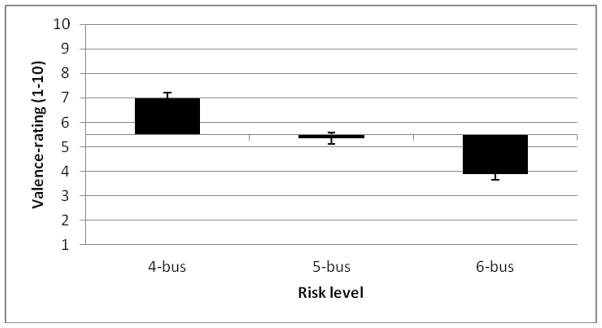
Self-report valence-ratings as a function of risk level. Ratings represent how much subjects liked the 4-bus, 5-bus, and 6-bus trials. Ratings of 5.5 or higher indicate positive subjective associations with the bus and ratings below 5.5 indicate negative subjective associations with the bus. Error bars represent ± SEM