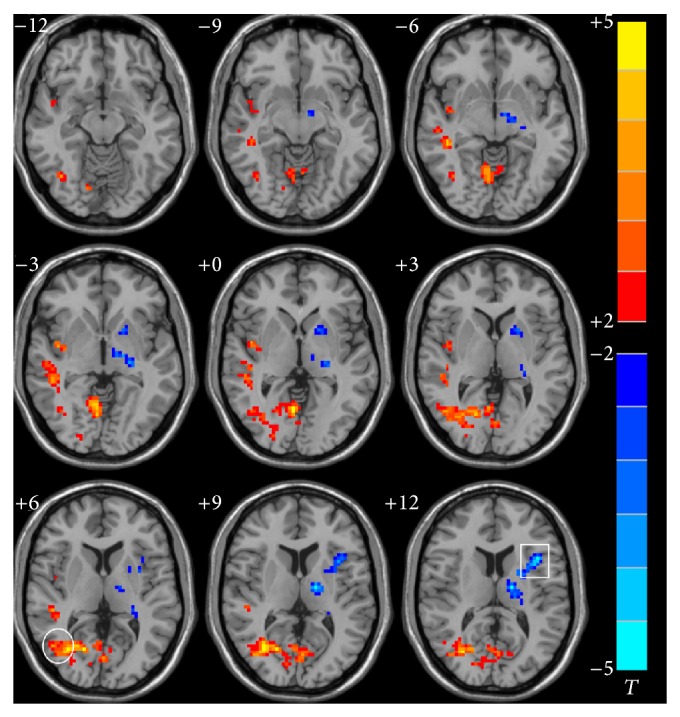
Figure 2.

Abnormal FC pattern of the right hippocampus in the ischemic stroke patients compared to HC in resting state. The voxels with hot color represent HFC positive functional connectivity, and the voxels with cold color represent HFC negative functional connectivity. (P < 0.05 and cluster size >=40 voxels, multiple comparisons corrected). Left is the right; right is the left. Square: inferior frontal gyrus. Circle: middle temporal gyrus.
