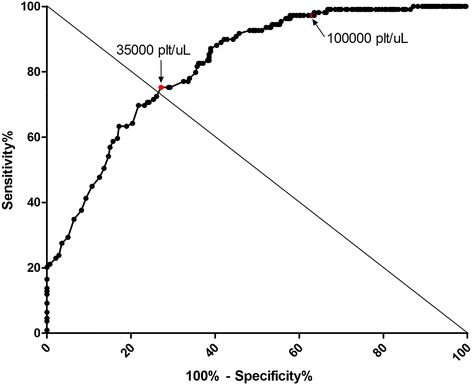
Figure 2.

Sensitivity (S) and specificity (E) of platelet count for prediction of severe dengue. Several intersection (cut-off) points were selected and S and E calculated for each. On the coordinates (abscissas) axis (1-E) and S on the ordinates axis. The ideal examination (S = 1 and E = 1) should be on the top-left angle of the graph. Cut-off value of 35,000 plat/μL showed the greatest sensitivity and specificity (S = 75% and E = 72.86%). A cut-off value of 100,000 plat/μL showed S of 97.25% and E of 37%. (N = 389, area under the curve ROC = 0.8199).
