Figure 5.

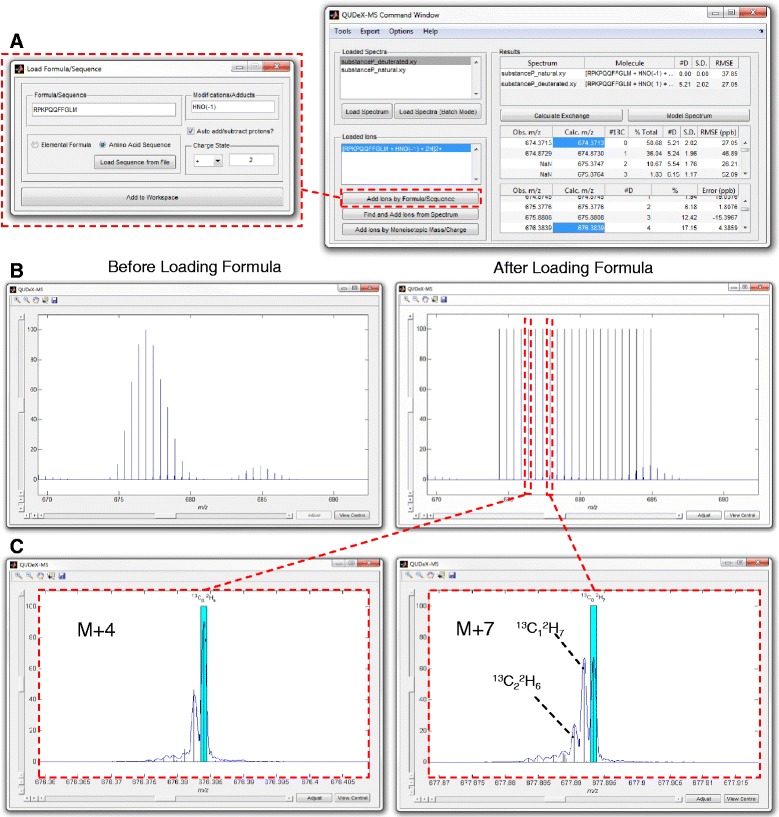
Determining deuterium incorporation from a molecule of known elemental composition and simulating a theoretical spectrum from calculated deuterium exchange. A. If the exact elemental formula (or amino acid sequence) of the ion signal to be analyzed is known, this can be provided to QUDeX-MS. If a peptide or protein is being analyzed, in addition to providing an amino acid sequence, the user can specify posttranslational modifications to the amino acid sequence (input as additions and subtractions of elemental atoms), from which the final elemental formula is determined. A specific charge state must also be chosen, which should correspond to a charge state observed in the mass spectrum to be analyzed. B. QUDeX-MS Spectrum Viewer before and after loading pseudomonoisotopic peak locations (appears as black lines when zoomed out). C. Zoomed in view at two fine isotope distributions corresponding to different nominal masses, with the pseudomonoisotopic peak for each distribution highlighted in cyan (black lines in B) and calculated theoretical isotopic fine structure based on estimated deuterium incorporation and the specified elemental formula shown as a line spectrum (vertical black lines in C). In the analysis of the example spectrum of deuterated substance P, the three major peaks within a fine structure distribution starting from the right moving leftwards are generally the deuterium-associated peaks corresponding to substance P with exactly 0, 1, or 2 13C (and no other natural abundance heavy isotopes) and decreasing number of deuterium, as specified in the panel for the M + 7.
