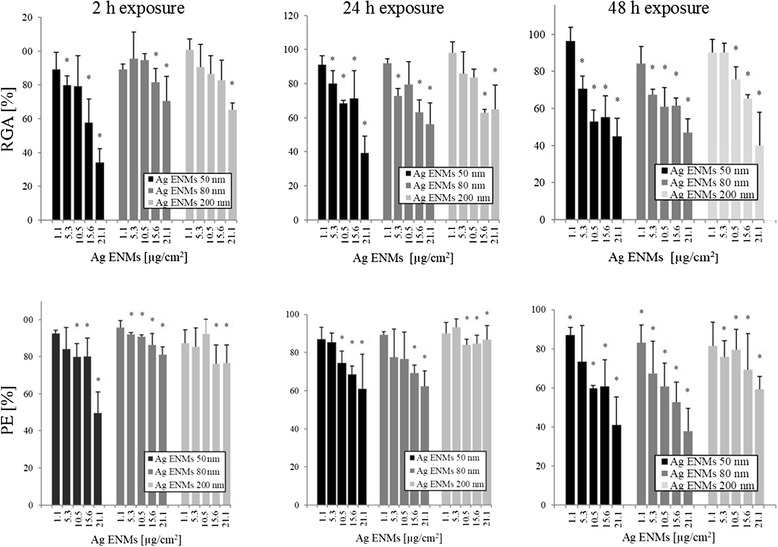
Figure 3.

Cytotoxic effects of 50 , 80 and 200 nm Ag ENMs on A549 cells measured as Relative growth activity (RGA) and Plating efficiency (PE). Relative growth activity (Upper figures): Cells were treated with 5 concentrations (μg/cm2) of Ag ENMs for 2, 24 and 48 h and cell number was counted immediately following staining. Plating efficiency (Lower figures): Cells were treated with 5 concentrations (μg/cm2) of Ag ENMs for 2, 24 and 48 h. Immediately after the exposure 100 cells per dish was inoculated and the number of cell clones was calculated after 10 days of incubation. Note that ENMs that had been internalised during the initial exposure remained in the cells and were diluted only by cell division over the 10 days. Columns represent cytotoxicity relative to 100% of control. The data are expressed as mean ± SD of three independent experiments. *a statistically significant (p < 0.05) difference from the unexposed (control) cells.
