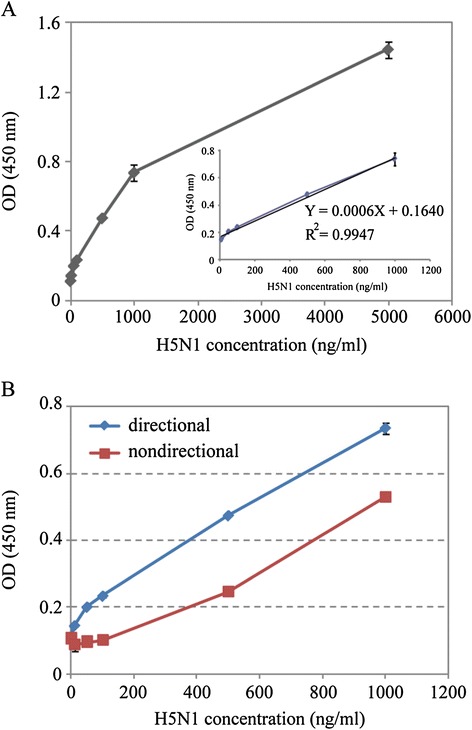
Figure 5.

Detection of H5N1 virus by directional sandwich ELISA and comparison with the conventionally undirectional ELISA. (A) Serial concentrations (0, 10, 50, 100, 500, 1000, 5000 ng/mL) of H5N1 antigen were used for detection. The linear relationship in the range from 50 to 1000 ng/mL. The linear equation was calculated as Y = 0.0006 X + 0.1640 with an acceptable correlation coefficient of 0.9947 (R2). The data represent mean ± standard deviation from triplicate measurements. (B) The concentration of H5N1 from 0 to 1000 ng/mL to test directional and undirectional sandwich ELISA system. Error bars are standard deviations of three measurements.
