
Figure 2. FpSDH Phosphorylation and CII Activity Are ROS Dependent.
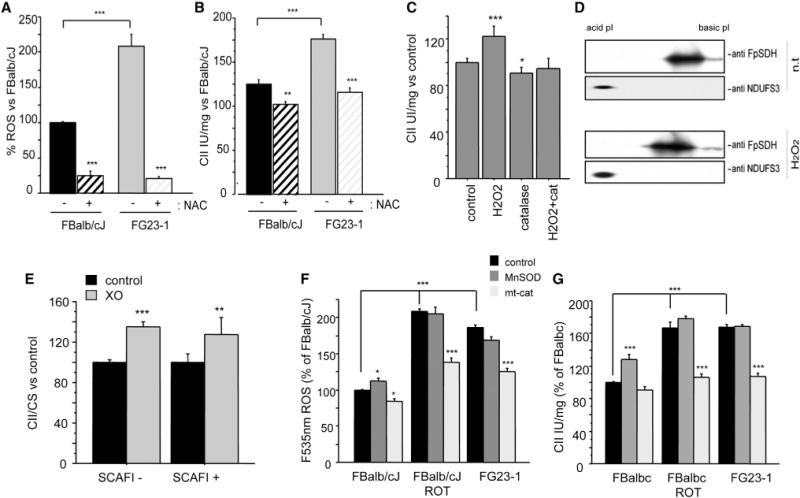
(A) ROS (H2O2) levels measured in nontreated (n.t.) FG23-1 and FBalb/cJ cells and in cells treated with NAC (5 mM, 7 days) (control, n = 35; NAC, n = 12).
(B) Effect of NAC treatment on CII activity in FBalb/cJ and in FG23-1 cells (untreated, n = 15; NAC, n = 4). Data in (A) and (B) are presented as the percentage of nontreated FBalb/cJ cells.
(C) CII activity in isolated mouse liver mitochondria treated for 10 min with H2O2 (50 μM), catalase (25 U/ml), or both (n ≥ 4).
(D) 2D IEF/SDS-PAGE (IEF strips pH 4–7) Western analysis of FpSDH from H2O2-treated mouse liver mitochondria.
(E) CII activity in mitochondria isolated from SCAFI– (left) and SCAFI+ (right) fibroblasts treated with the ROS generator xanthine oxidase (XO) (n = 4). Data are presented as the percentage of activity in nontreated fibroblasts.
(F) H2O2 production in FG23-1 and rotenone-treated FBalb/cJ fibroblasts is prevented by expression of mitochondrially targeted catalase (mt-cat, n = 5).
(G) Elevated CII activity in FG23-1 and rotenone-treated FBalb/cJ cells is prevented by expression of mt-cat but not MnSOD (n = 3). *p < 0.01; **p < 0.001; ***p < 0.0001.
All data are presented as mean ± SD. See also Figure S2.