
Figure 5. T Cell Activation and CII Activity Response.
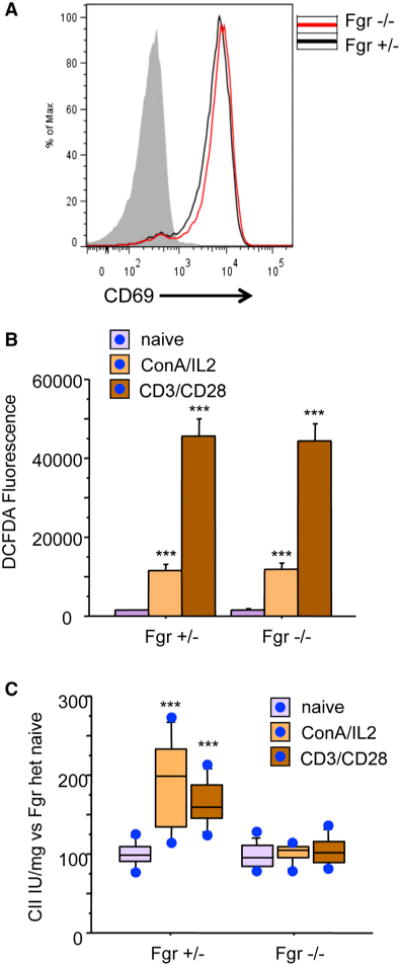
(A) Flow cytometry analysis of T cell activation. Naive T cells from Fgr+/− and Fgr−/− mice were activated with anti-CD3/CD28, and activation was assessed by detection of CD69. Gray line: negative control. The chart shows data from one representative experiment of four.
(B) Flow cytometry analysis of ROS production (2,7-DCFH2-DA) in resting T cells and upon CD3/CD28 or ConA activation (n = 3). Data are presented as mean ± SD.
(C) CII activity measured in resting and activated T cells (n = 4). Data are presented as the percentage of activity compared to resting T cells. Lines extending from the boxes indicate the variability outside the upper and lower quartiles.