
Figure 6. Mitochondria Lacking Fgr or Expressing Y604F FpSDH Respond Abnormally to Starvation and Serum Deprivation.
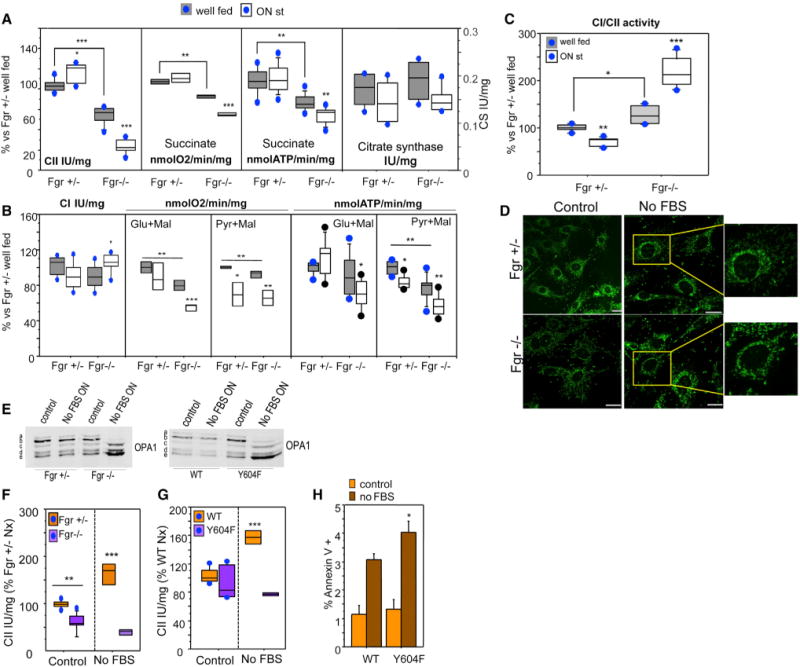
(A) Succinate-driven OXPHOS function in mouse liver mitochondria from Fgr+/− and Fgr−/− mice fed a normal diet (well fed) or starved overnight (ON st, n ≥ 4). CII activity (left), succinate-driven respiration (center left), succinate-driven ATP synthesis (center right), and citrate synthase activity (CS, right).
(B) NADH-driven OXPHOS function in mouse liver mitochondria from Fgr+/− and Fgr−/− mice fed a normal diet or starved overnight (n ≥ 4). CI activity (left), glutamate-driven respiration (center left), pyruvate-driven respiration (center), glutamate-driven ATP synthesis (center right), and pyruvate-driven ATP synthesis (right) are shown.
(C) Rate of use of NADH/FADH reducing equivalents in mouse liver mitochondria from Fgr+/− and Fgr−/− mice (n ≥ 4). Data in (A)–(C) are presented as the percentage of values obtained in well-fed Fgr+/− mice. Lines extending from the boxes indicate the variability outside the upper and lower quartiles.
(D) Immunostaining of mitochondria (Tom20, green) in Fgr+/− and Fgr−/− fibroblasts cultured with serum or without serum overnight (No FBS ON).
(E) Immunoblot showing the migration of OPA1 in lysates from control and serum-deprived Fgr+/− and Fgr−/− cells (left) or control and serum-deprived FpSDH-silenced fibroblasts re-expressing WT or Y604F FpSDH (right).
(F)CII activity in Fgr+/− and Fgr−/− fibroblasts grown in 10 mM glucose in the indicated conditions (n ≥ 5). Data are presented as the percentage activity in Fgr+/− cells grown in normoxia; lines extending from the boxes indicate the variability outside the upper and lower quartiles.
(G)CII activity in FpSDH-silenced fibroblasts re-expressing WT or Y604F FpSDH, cultured at 5 mM glucose under the indicated oxygenation conditions (n ≥ 5). Data are presented as the percentage of activity in WT-expressing cells grown in normoxia; lines extending from the boxes indicate the variability outside the upper and lower quartiles.
(H) Apoptotic events in FpSDH-silenced fibroblasts re-expressing WT or Y604F FpSDH and grown with or without serum. Apoptosis was determined by flow cytometry as the percentage of cells positive for annexin V and propidium iodide (n = 3). Data are presented as mean ± SD. *p < 0.01; **p < 0.001; ***p< 0.0001.
See also Figures S4 and S5.