
Figure 7. Mitochondria Lacking Fgr or Expressing Y604F FpSDH Respond Abnormally to Hypoxia-Reoxygenation.
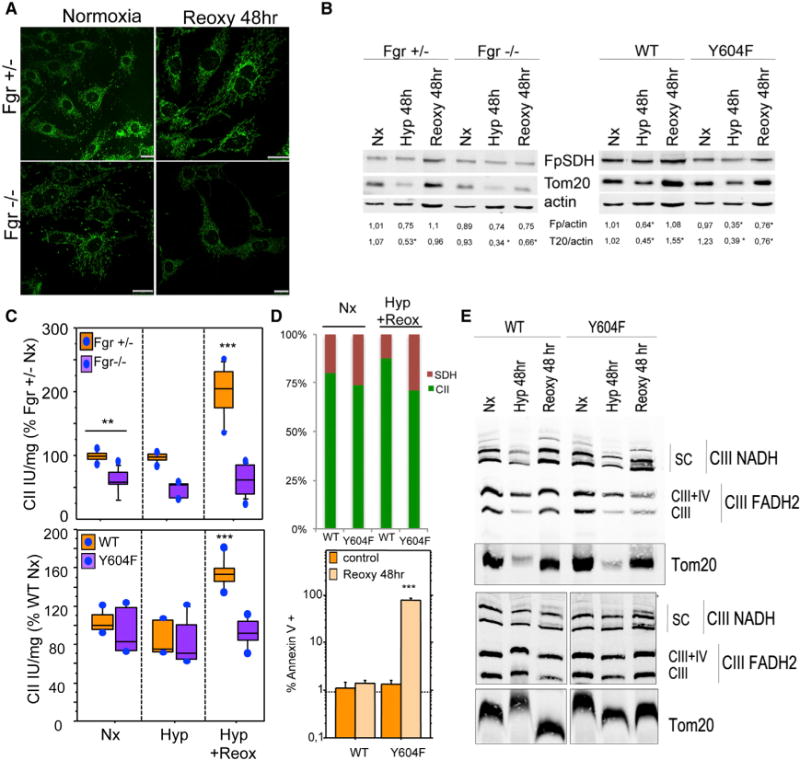
(A) Immunostaining of mitochondria (Tom20, green) in Fgr+/− and Fgr−/− fibroblasts cultured in normoxia (21% O2) or hypoxia (1 % O2)for48 hr followed by 48 hr normoxia (Reoxy 48 hr).
(B)Left: Immunoblot analysis of Fgr+/− and Fgr−/− cells cultured under normoxia (Nx), hypoxia for 48 hr(Hyp 48 hr), or hypoxia followed by normoxia (Reoxy 48 hr). Right: Immunoblot analysis of FpSDH-silenced fibroblasts re-expressing WT or Y604F FpSDH and cultured under the indicated oxygenation conditions. Numbers beneath blots show FpSDH (Fp):actin and Tom20 (T20):actin ratios (n = 4).
(C) Top: CII activity in Fgr+/− and Fgr−/− fibroblasts grown in 10 mM glucose under the indicated conditions (n ≥ 5). Bottom: FpSDH-silenced fibroblasts re-expressing WT or Y604F FpSDH, cultured with 5 mM glucose under the indicated oxygenation conditions (n ≥ 5). Data are presented as the percentage activity in Fgr+/− cells or WT-FpSDH-re-expressing cells grown in normoxia; lines extending from the boxes indicate the variability outside the upper and lower quartiles.
(D) Top: Relative activities of CII (CoQ reduction) and SDH in WT- and Y604F-re-expressing FpSDH-silenced cells grown in normoxia or through a hypoxia/reoxygenation cycle. For each cell line and condition, 100% = the sum of CII and SDH activities; absolute SDH activity did not differ between cell lines and conditions. Bottom: Apoptotic events in FpSDH-silenced fibroblasts re-expressing WT or Y604F FpSDH and grown in normoxia or through a hypoxia/reoxygenation cycle. Apoptosis was determined by flow cytometry as the percentage of annexin V- and PI-positive cells (n = 3). Data are presented as mean ± SD.
(E) BNGE of FpSDH-silenced fibroblasts re-expressing WT or Y604F FpSDH cultured at 5 mM glucose under the indicated oxygenation conditions; the blot reveals the distribution of CIII (anti-core 1 immunodetection) among the different forms of free complex and supercomplexes. The outer membrane protein Tom20 is used as a mitochondrial protein loading control. Upper and lower panels are taken from two independent experiments. Note that upon reoxygenation the amount of CIII super assembled with CI is abnormally elevated in the Y604F mutant. See also Figure S5.