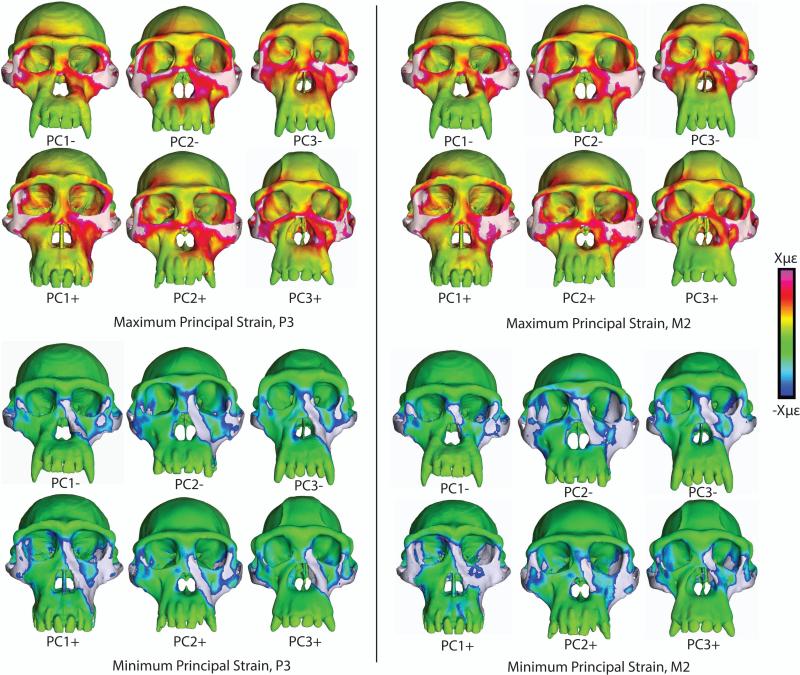
Figure 7.
Visualization of normalized scale color maps to depict the relative principal strains in finite element models of chimpanzee crania during simulated bites on the third premolar and second molar. Color scale corresponds to the average of strain values collected from ten locations on each model for each bite point. The scale ranges from –X to X, where X differs in each image as follows: Premolar bite, maximum principal strain: PC1- : 502; PC1+ : 486; PC2- : 556; PC2+ : 477; PC3-: 370; PC3+ : 473. Premolar bite, minimum principal strain: PC1- : 441; PC1+ : 371; PC2- : 484; PC2+ : 405; PC3- : 336; PC3+ : 239. Molar bite, maximum principal strain: PC1- : 446; PC1+ : 446; PC2- : 516; PC2+: 420; PC3- : 311; PC3+ : 423. Molar bite, minimum principal strain: PC1- : 354; PC1+ : 288; PC2- : 325; PC2+ : 301; PC3- : 239; PC3+ : 317. White indicates areas where strain magnitudes exceed the color scale.

