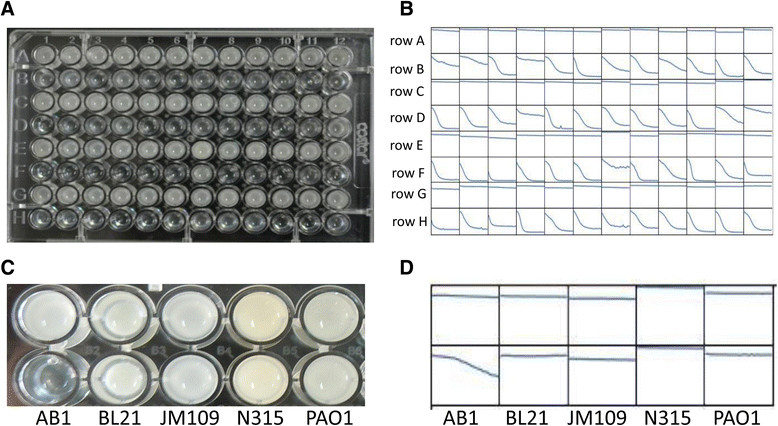
Figure 5.

Lytic activity of PlyAB1 against the 48 clinical PDRAB isolates. (A) PlyAB1 lytic activity results for 48 PDRAB isolates 30 min after addition of the enzyme. Blue bar denotes the OD600 at 0 min, red bar denotes the OD600 30 min later. (B) Rows A, C, E, and G represent the negative control groups containing buffer lacking PlyAB1 protein. Rows B, D, F, and H represent the trial groups (with PlyAB1 protein). Changes in the OD600 at 30 min were recorded by a microplate reader. (C and D) Lytic range of PlyAB1. Left to right: AB1, BL21, JM109, N315, and PAO1. PlyAB1 can only lyse A. baumannii AB1.
