
Fig. 2. Heat map of the univariate correlations among the serum protein biomarkers.
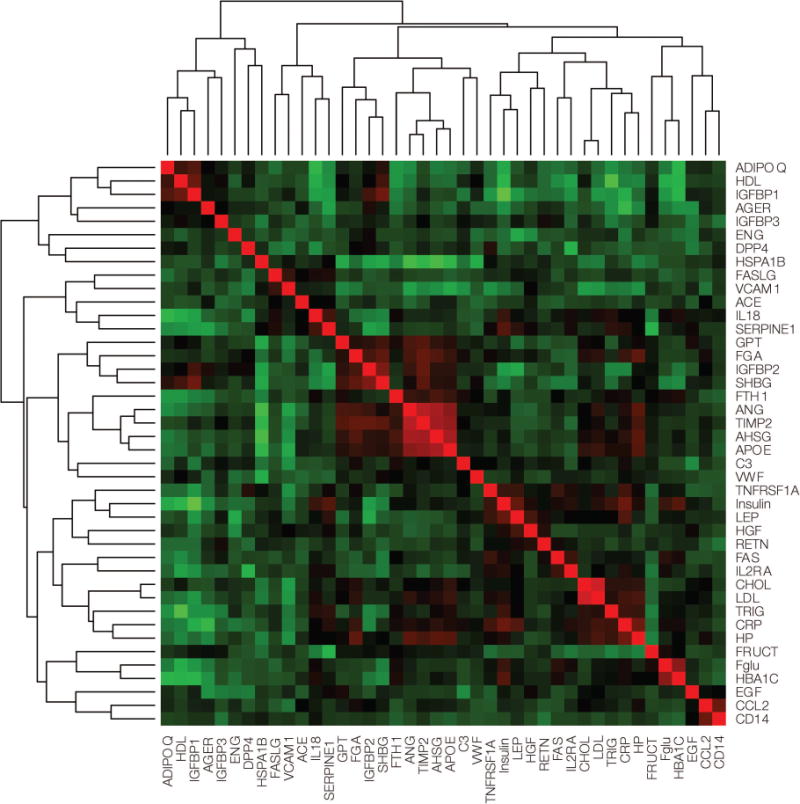
Pearson correlation was used to estimate associations among biomarkers on transformed concentrations. For key to abbreviations, see Table 2.
Official websites use .gov
A
.gov website belongs to an official
government organization in the United States.
Secure .gov websites use HTTPS
A lock (
) or https:// means you've safely
connected to the .gov website. Share sensitive
information only on official, secure websites.
Pearson correlation was used to estimate associations among biomarkers on transformed concentrations. For key to abbreviations, see Table 2.