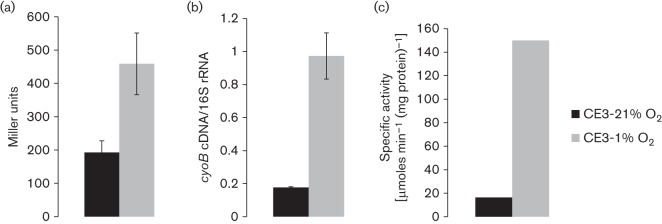
Fig. 5.

Comparison of cyo expression and quinol oxidase activity at low (1 %) versus high (21 %) oxygen. Wild-type cells were grown either in 21 or 1 % O2. Protein, RNA and membranes were all extracted from cells in the exponential phase. (a) Beta-galactosidase activity of wild-type cells carrying the transcriptional fusion plasmid, pZL39 (cyoA :: lacZ). Mean±sd values were calculated from three or more separate lacZ assays from two different cultures. (b) qRT-PCR of cyoB. RNA was extracted and converted to cDNA using the reverse gene-specific primer. As described in Methods, cDNA was then quantified by qPCR. The amount of cyoB cDNA (ng) was then normalized to the amount of 16S rRNA cDNA (pg) from the original RNA sample. Mean±sd values were calculated from three separate qPCR assays. (c) Specific quinol oxidase activity of wild-type solubilized membranes. Wild-type cells were grown in six separate 120 ml serum vials containing 10 ml of TY medium. These cultures were pooled together and the membranes were prepared and solubilized as described in Methods. In these experiments, growth was in serum vials rather than in Erlenmeyer flasks as described in Fig. 2.
