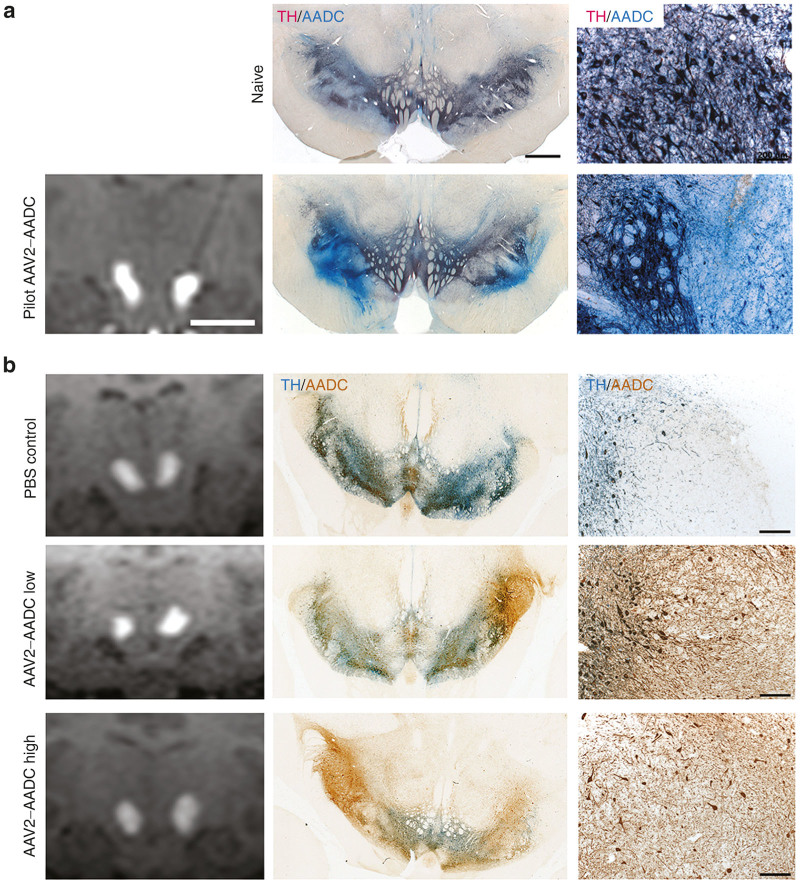
Figure 3.
AADC expression in the mid-brain of (a) pilot and (b) toxicology study animals. AADC staining of mid-brain revealed good correlation between infusate (gadolinium) signal in MRI and AAV2-hAADC expression (left and middle columns). AADC signal (brown) in SNpc and VTA that colocalized with endogenous tyrosine hydroxylase signal (blue, middle column). Although transgenic AADC in these nuclei was indistinguishable from endogenous AADC, AAV2-hAADC gene product was easily visible in SNpr when compared to naïve animal images. Higher magnification images show transgenic AADC staining in cells and fibers (right column). Scale bars: Left and middle columns: 1 cm; right column: 200 μm.

