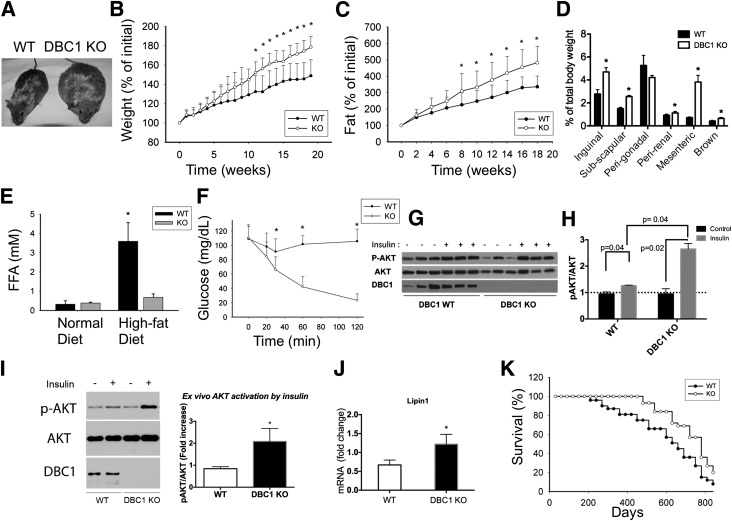
Figure 2.
Deletion of DBC1 in vivo increases fat tissue accumulation capacity and prevents FFA spill over, protecting against insulin resistance. A: Representative photograph of WT (left) and DBC1 KO (right) siblings at 6 months of age and after 4 weeks of being fed the high-fat diet. B: Weight gain of WT and DBC1 KO mice fed the high-fat diet. The mice were switched from regular breeding chow to the high-fat diet starting at 6 months of age. Weight gain was monitored periodically during the treatment (n = 16 mice per group). *P < 0.05. C: Fat accumulation in the same mice described in B. Fat content in vivo was measured by MRI scanning (n = 16 mice per group). *P < 0.05. D: Quantification of different fat depots in WT and DBC1 KO mice after being fed the high-fat diet for 12 weeks. Fat tissue weight was expressed, corrected by total body weight (n = 5 mice per group). *P < 0.05. E: FFA levels in blood in WT and DBC1 KO adult mice fed regular breeding chow or after 12 weeks of the high-fat diet (n = 8 mice per group). *P < 0.05. F: Insulin tolerance test in WT and DBC1 mice fed the high-fat diet for 12 weeks. After 6 h of food starvation, mice were challenged with 0.5 units/kg of intraperitoneal insulin, and glycemia was monitored over time (n = 8 mice per group). *P < 0.05. G: Western blot shows phosphorylation of AKT (p-AKT) in inguinal fat tissue after WT and DBC1 KO mice fed the high-fat diet were challenged with 0.5 units/kg insulin for 15 min. H: Band intensity was measured by densitometry and expressed as the ratio of p-AKT to total AKT. I: Ex vivo insulin sensitivity in fat tissue from WT and DBC1 KO mice after 12 weeks of being fed the high-fat diet. Inguinal fat was incubated in Krebs-Ringer buffer with 5 mU/L insulin for 15 min. Tissue was later processed for Western blotting. Left, Representative Western blot of p-AKT after incubation with insulin. Right, Quantitation of p-AKT after insulin treatment expressed as the fold increase over control (no treatment) (n = 5 mice per group). *P < 0.05. J: Expression of lipin1 mRNA in inguinal fat tissue of WT and DBC1 KO after 12 weeks of the high-fat diet (n = 4). *P < 0.05. K: Survival curve of WT and DBC1 KO mice fed standard chow until 6 months of age and then fed the high-fat diet (n = 22 mice per group).

