Figure 5.
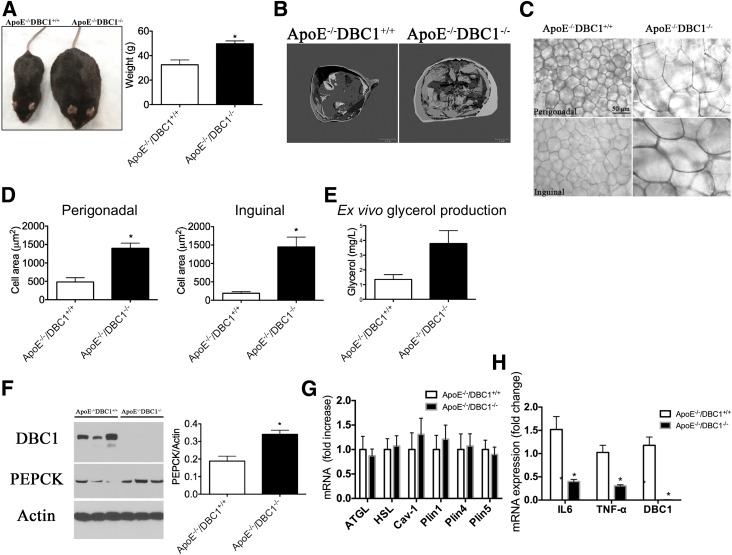
ApoE−/−DBC1−/− mice have increased fat accumulation capacity and decreased inflammation in fat tissue. A: Left, Representative photograph of ApoE−/−DBC1+/+ (left side) and ApoE−/−DBC1−/− (right side) mice after 20 weeks of being fed the Western diet. Right, Weight of ApoE−/−DBC1+/+ and ApoE−/−DBC1−/− mice at the end of the treatment with the Western diet (n = 8 per group). *Shows significant difference at P < 0.05, t test. B: Representative CT scan shows fat tissue content and distribution of adult ApoE−/−DBC1+/+ and ApoE−/−DBC1−/− mice after 20 weeks of being fed the Western diet. C: Representative picture of fat cell size in perigonadal (upper panels) and inguinal (lower panels) fat depots dissected from ApoE−/−DBC1+/+ and ApoE−/−DBC1−/− mice after 20 weeks of being fed the Western Diet. D: Fat cell size measurement in perigonadal (left) and inguinal (right) fat tissue depots of ApoE−/−DBC1+/+ and ApoE−/−DBC1−/− mice after 20 weeks of being fed the Western diet (n = 3 per group). *Shows significant difference at P < 0.05, t test. E: Ex vivo glycerol production and release from inguinal fat tissue in response to pyruvate in mice after 5 weeks of being fed the Western diet (n = 5 per group). *Shows significant difference at P < 0.05, t test. F: PEPCK expression in the same mice and conditions described in D (n = 3 per group). *Shows significant difference at P < 0.05, t test. G: Gene expression analysis of lipolysis markers in inguinal fat tissue of ApoE−/−DBC1+/+ and ApoE−/−DBC1−/− mice after 20 weeks of being fed the high-fat diet (n = 6 per group). H: Gene expression analysis of inflammation markers in inguinal fat tissue of ApoE−/−DBC1+/+ and ApoE−/−DBC1−/− after 20 weeks of being fed the high-fat diet (n = 5 per group). *Shows significant difference at P < 0.05, t test.

