
Figure 2.
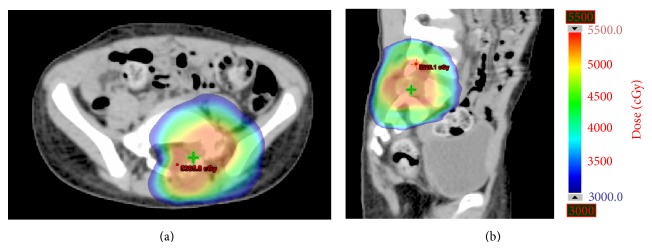
Isodose curves. Axial (a) and sagittal (b) representative isodose curves from the treatment plan used for the osteosarcoma lesion depicted in Figure 1.
Official websites use .gov
A
.gov website belongs to an official
government organization in the United States.
Secure .gov websites use HTTPS
A lock (
) or https:// means you've safely
connected to the .gov website. Share sensitive
information only on official, secure websites.
Isodose curves. Axial (a) and sagittal (b) representative isodose curves from the treatment plan used for the osteosarcoma lesion depicted in Figure 1.