
Figure 2.
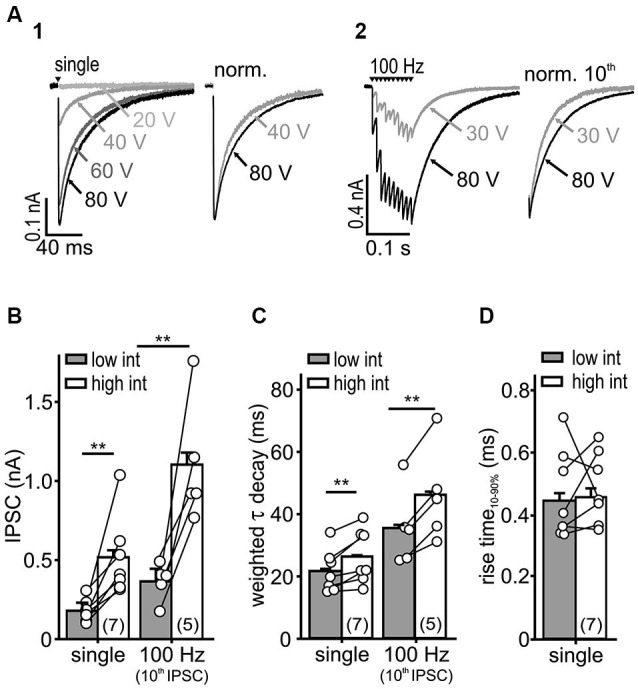
IPSC kinetics depends on stimulus intensity. (A) Representative IPSC traces evoked by a single (A1) or repetitive stimulation (A2) at varying stimulus intensities. Higher stimulus intensities evoked IPSCs of longer decays during single and repetitive stimulations (right: normalized last IPSCs). (B,C) Both IPSC amplitude (B) and τwd (C) increased with stimulation intensity (cell numbers are given in parentheses, p < 0.01, paired t-test). (D) The IPSC rise-time was unaffected by the stimulus intensity (n = 7, p = 0.79, paired t-test).