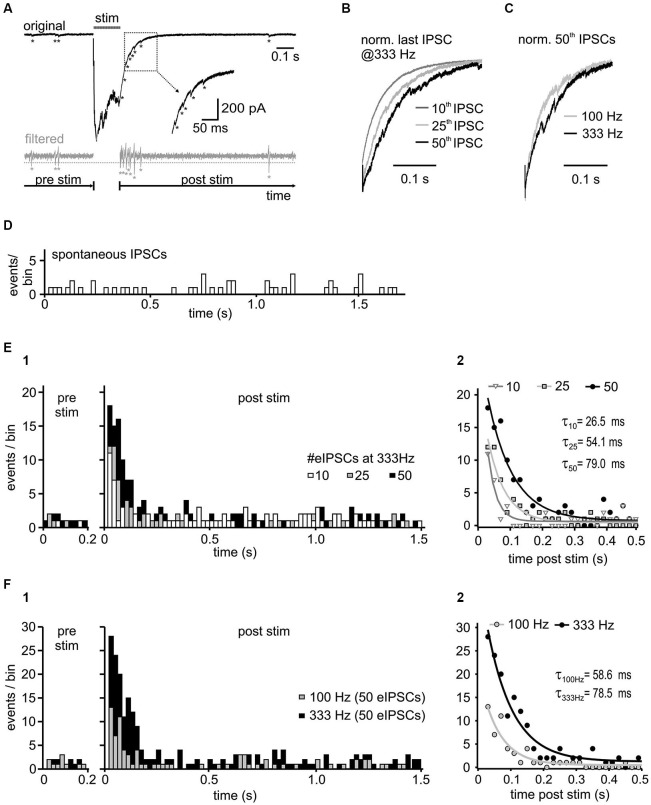
Figure 5.
Activity-dependence of asynchronous release. (A) Representative trace with detected asynchronous release events, before and after 50 stimuli at 333 Hz (upper panel). For event detection the signal was bandpass filtered between 50 and 1500 Hz (bottom panel). Potential events were detected when the filtered current amplitude exceeded 1.96 times (p < 0.05) the standard deviation of the noise (dashed gray line). Note the increased incidence of events in the decay phase of the last IPSC. (B) Normalized last IPSCs elicited by different numbers of stimuli in a 333 Hz train. (C) Superimposed normalized last IPSCs in a 50-pulse train at 100 Hz and 333 Hz. (D) Histogram of spontaneous IPSCs before synaptic stimulation of inhibitory inputs (n = 4 cells, bin width: 20 ms). (E1) Histograms of asynchronous release events before ( = spontaneous events, pre stim) and after the 333 Hz input stimulation ( = asynchronous and spontaneous events, post stim) with different number of stimuli (n = 4 cells, bin width: 20 ms, post stim t = 0 refers to the time of the last IPSC in the train). Following synaptic stimulation, the time course of asynchronous events relaxed back to the resting state with a mono-exponential function. The increase of asynchronous events during the decay phase depends on the presynaptic activity. (E2) Mono-exponential fits to the data from (E1). The initial incidence of events, and the time constant (τ) depend on stimulus number (10 vs. 25 vs. 50 stimuli p < 0.05 for each comparison). (F) Input frequency determines the amount of asynchronous release. (F1) Summary histograms of asynchronous events from 6 cells, before and after 50-pulse stimulation at 100 Hz and 333 Hz. (F2) Mono-exponential fits to the data from F1. The initial incidence of events was increased and the exponential time constant prolonged with higher input frequency (100 Hz vs. 333 Hz p < 0.05).

