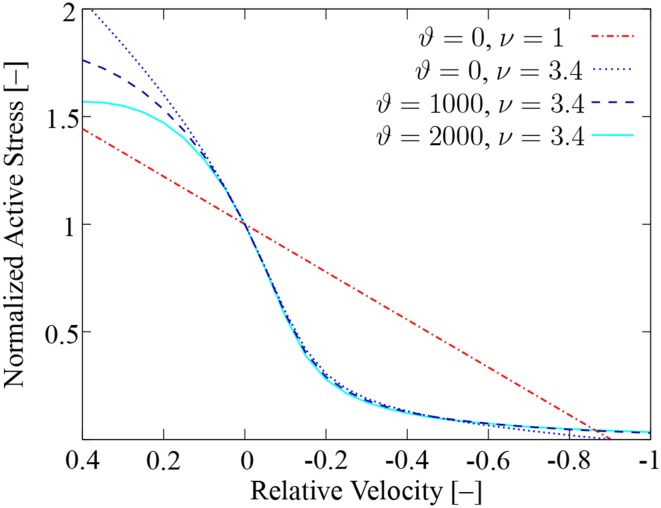
Figure 4.
F-v relation of an isolated half-sarcomere model. Shown is the relation for constant rate coefficients (red dash-dotted line), for variability in f0 only (blue dotted line), and for additional variability in g0 (blue dashed line and turquoise solid line). To depict the Hill relation in its typical form, the x-axis is inverted to show shortening contractions on the right.

