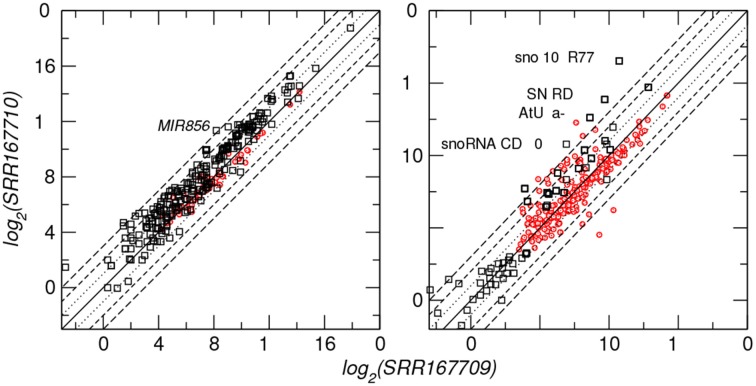
Figure 7.
Differential expression of microRNAs (left panel) and snoRNA-derived small RNAs (right panel) for two A. thaliana datasets. Diagonal lines indicate differences between 23 and 2−3 fold. Black symbols indicate annotated microRNA and snoRNA loci, red dots refer to novel predictions. A few loci with extreme expression differences are labeled.

