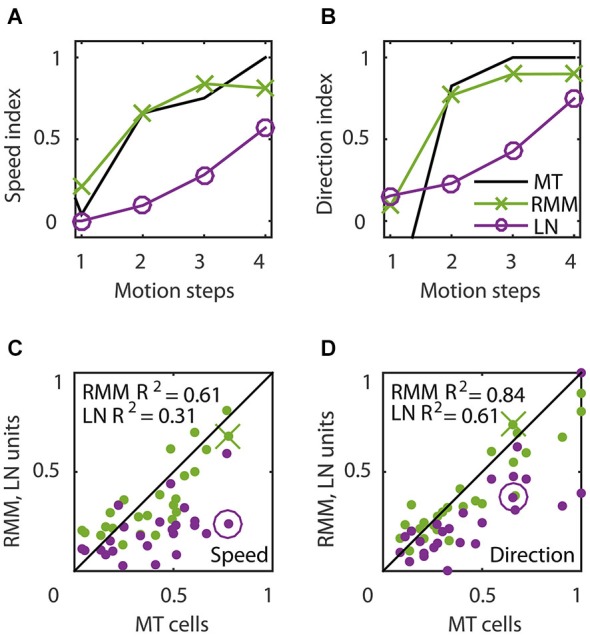
Figure 6.

Temporal dynamics of speed tuning and direction selectivity. (A,B) Speed tuning index (A) and direction selectivity index (B) as a function of the number of motion steps for an example MT cell (black curve) and corresponding RMM output unit (green) and LN-model output (magenta). The speed and direction selectivity index of the example RMM and LN unit are displayed in (C) and (D) with a cross and circle, respectively. (C) Average speed tuning index over the motion steps, for all RMM output units (green) and their LN-models (magenta) compared to the speed tuning index of the corresponding MT cells. (D) Same as (C) for the direction selectivity index. This figure shows that, while the output units of the RMM captured the full speed tuning and direction selectivity properties of most MT cells, the LN model generally fails to do so.
