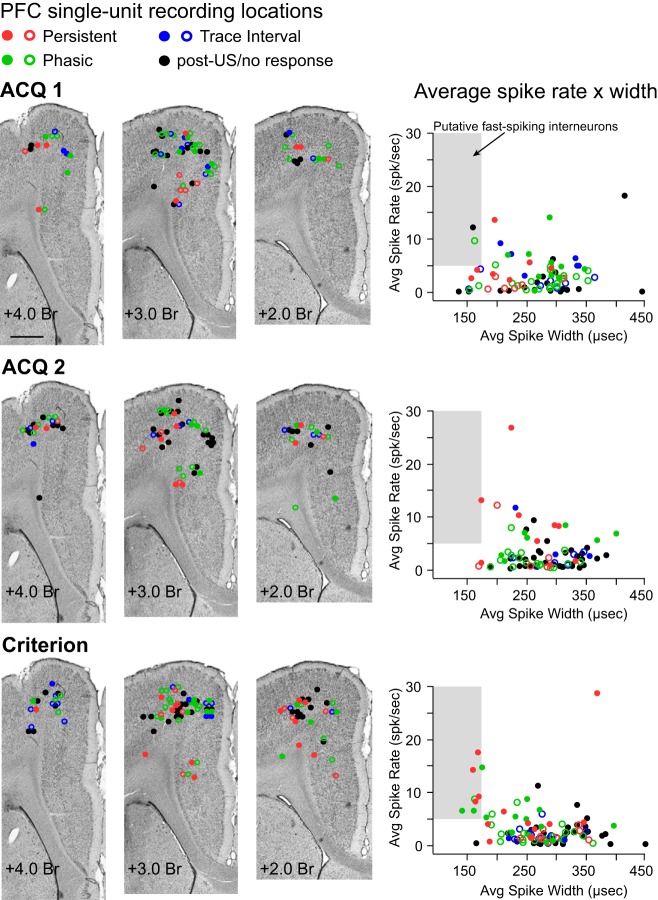
Fig. 2.
Estimated sites of single-unit activity for cells recorded on different training days (ACQ1, ACQ2, and Criterion sessions) and scatterplots of the average firing rate and spike width of each single unit to disambiguate putative pyramidal cells from fast-spiking interneurons. Colored circles represent single units that showed a given response type (red, persistent; green, phasic; blue, trace interval, black, US/posttrial/no response) and indicate whether the cell increased (filled circle) or decreased (open circle) spike activity in response to conditioning stimuli. Left: representative Nissl-stained coronal sections at 3 locations along the rostrocaudal plane of the mPFC, with markers indicating the estimated recording site of each single unit on each training day analyzed. All cells were recorded within the medial agranular or caudal anterior cingulate regions of the mPFC. Scale bar, 1 mm. Right: scatterplots of average spike width × average firing rate for each single unit, plotted separately for each training day (color-coded as described above). Fewer than 15% of cells in each condition would be designated as putative interneurons for this data set (shaded gray area).

