Fig. 6.
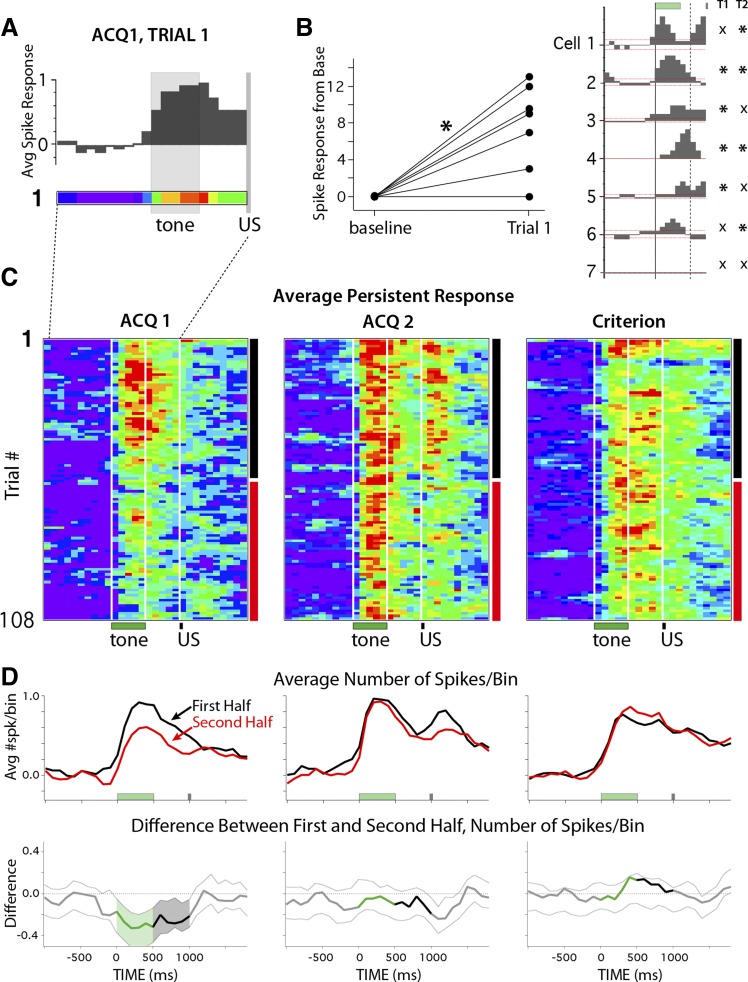
Activity profiles of persistent cells on the first training trials and over training sessions for the first (ACQ1, n = 7 cells) and second (ACQ2, n = 9 cells) days of training and during Criterion sessions (n = 13 cells). A: histogram and pseudocolored spike train (100-ms bins) of the averaged response of persistent cells for the very first presentation of the tone stimulus (normalized to the pretrial average of that trial; color scale: 0–1 spikes above baseline). Note that the first trial of each session is a tone-only probe, so the timing of the US is indicated but was not presented on this trial. B, left: persistent cells showed a significant increase in spike activity in response to tone presentation on the first trial (shown normalized to baseline; paired t-test: *P = 0.005). Right: histograms of the response patterns of persistent cells on the first trial (green and gray bars indicate timing of stimuli, dashed vertical line indicates minimum length of persistent response that could support cerebellar learning, and dashed horizontal red line indicates 95% confidence intervals for reliable changes from baseline). Asterisks denote cells that showed persistent response patterns on trial 1 (TI) and trial 2 (T2). Six of the 7 cells showed a persistent response to tone presentation before the animal had ever experienced a paired trial. C: pseudocolored matrices (color scale = 0–1 spikes above baseline) of the average spike response of persistent cells for each trial (100-ms bins) of a given session (108 trials) for ACQ1, ACQ2, and Criterion sessions. For each trial bin, the average response was compared between the first half (black vertical bars) and second half (red vertical bars) of sessions. White vertical lines indicate onset/offset of training stimuli (with every 9th trial as a tone-only probe beginning with the first trial). D, top: line graphs showing average change in spike activity from baseline for persistent cells during the first half (black lines) and second half (red lines) of sessions. Bottom: line graphs showing the difference between session halves (downward deflection indicates decrease), with dashed lines indicating 99.5% confidence intervals at each time bin. Shaded regions show reliable changes from zero, color-coded for trial epoch (green, tone CS; black, trace interval). Persistent responses showed reliable decreases in magnitude on the first day of training, which was not observed in the following sessions.

