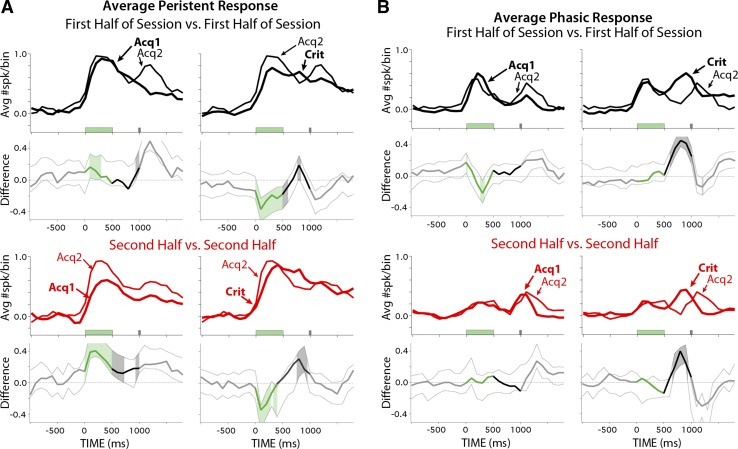
Fig. 8.
Comparison of the average spike response above baseline of persistent (A) and phasic cells (B) for the first half of ACQ2 (thin black lines) relative to ACQ1 or Criterion (heavy black lines) and difference scores and confidence intervals for each comparison, as described for Fig. 6D. The second halves of sessions were also compared across training days (red lines). A, top graphs: during the first half of sessions, persistent cells showed shorter latencies to initial spike response but were of similar magnitude between the first 2 days of training and showed a decrease in magnitude between ACQ2 and Criterion sessions. Bottom graphs: persistent cells showed an increase in response magnitude during the last half of sessions between the first and second days of training, supporting previous analysis. B: phasic cells showed similar response magnitudes to the tone during the first and second halves of sessions between all training days analyzed.

