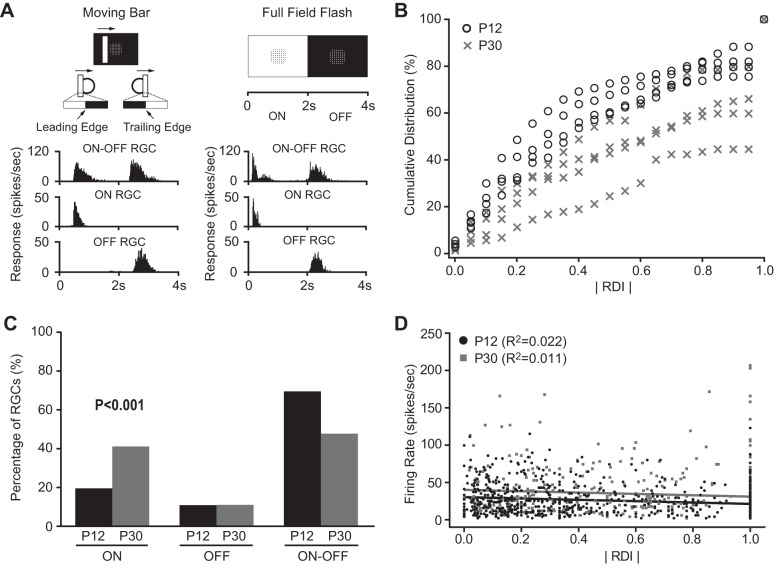
Fig. 1.
Characterization of direction-selective ganglion cells (DSGCs) by a 60-channel multielectrode array (MEA) system. A: retinal ganglion cells (RGCs) were classified into ON, OFF, and ON-OFF subtypes based on their responses to the moving bar (left) and/or full-field flash (right) stimuli. Left panel shows the white bar moving upon a black background. The circle illustrates a cell's receptive field (RF). Right panel shows the full screen flash stimuli (with MEA electrodes positioned at the center). B: the cumulative distribution of absolute values of response dominance index (RDI) of all recorded RGCs of mice at postnatal day 12 (P12) (n = 4) and P30 (n = 4). ON-OFF RGCs had RDI close to 0, while ON RGCs and OFF RGCs were close to 1 or −1. Bin width: 0.05. C: more ON RGCs and fewer ON-OFF RGCs were found at P30 compared with P12 (P < 0.001 in χ2 test). D: plot of absolute RDI vs. firing rate of RGCs at P12 and P30. Solid lines represent the linear regressions. The value of R2 ranges from 0 to 1, with 0 representing no linear relationship and 1 perfect linear relationship between the two parameters.

