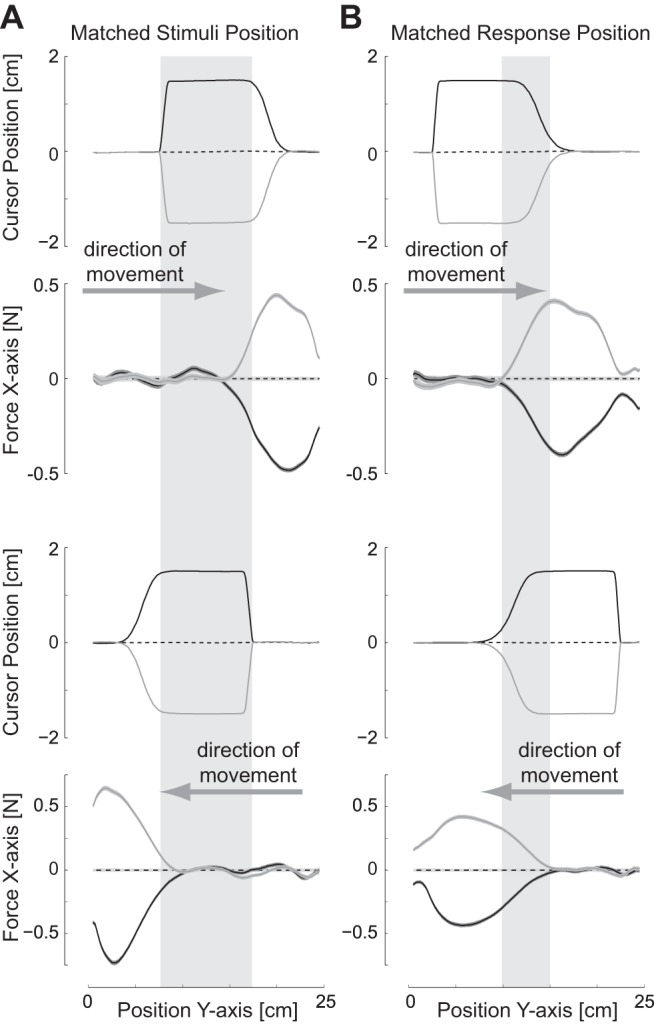
Fig. 2.

Comparison of the timing of perturbations in experiment 1. For each movement direction, the cursor position (x-axis) and the corresponding change in force against the channel wall (x-axis) are plotted as a function of the position in the y-axis. Mean and SE (shaded region) are plotted across all 24 subjects from experiment 1. A: forces during the 30% onset cursor perturbations (matched stimuli position) for the outward reaching (top) and inward reaching (bottom) movements. Shaded gray region demonstrates the matched positions (limb postures) over which the cursor perturbations in the outward and inward movements occur. B: forces during the 10% onset cursor perturbations (matched response position) for the outward reaching (top) and inward reaching (bottom) movements. Shaded gray region demonstrates the matched positions (limb postures) over which the force responses to the visuomotor perturbation in the outward and inward movements occur.
