Fig. 8.
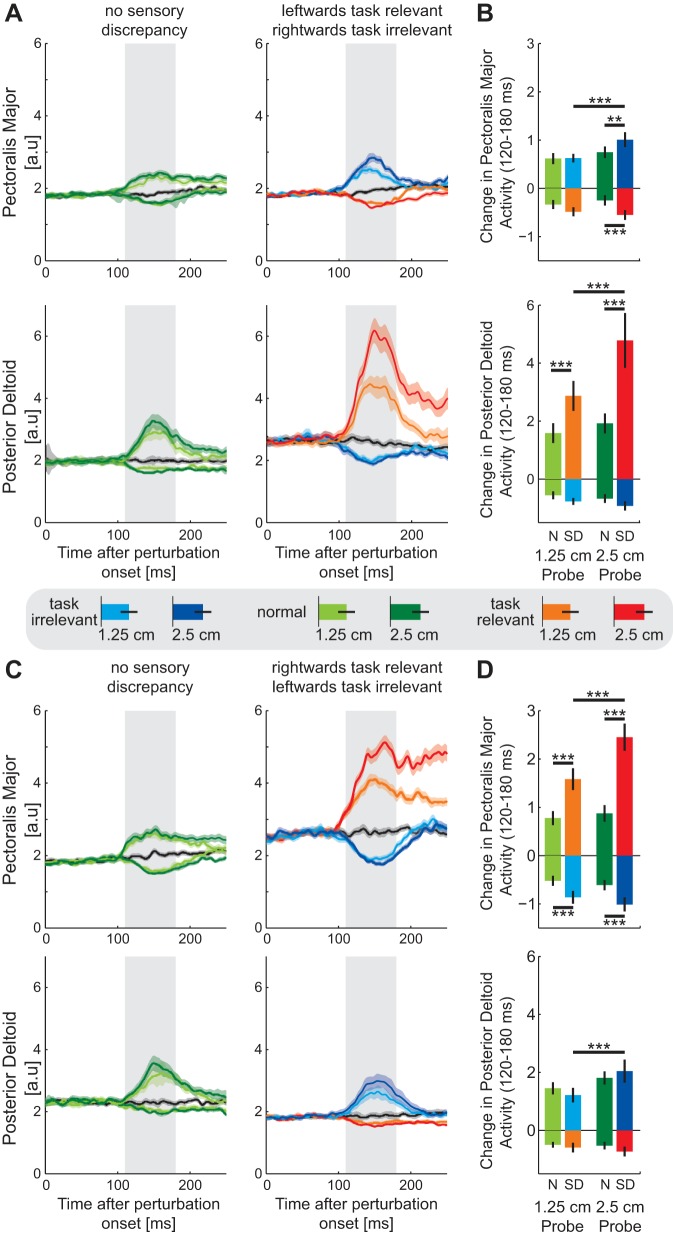
Muscular responses to visual perturbations (probe trials) during experiment 2. A: mean (solid line) ± SE (shaded region) muscle activity [arbitrary units (a.u.)] in the pectoralis major (top) and posterior deltoid (bottom) for perturbations in the normal (left) and leftward task-relevant sensory discrepancy (right) environments. Responses to the perturbations into the task-relevant part of the environment are shown in orange (1.25 cm) and red (2.5 cm), into the task-irrelevant part of the environment in light (1.25 cm) and dark (2.5 cm) blue, and into the normal environment in light (1.25 cm) and dark (2.5 cm) green. The response to the zero visual perturbation condition is shown in black. Shaded gray bar indicates the involuntary response interval (120–180 ms). B: mean ± SD muscular response over the involuntary interval (180–230 ms) for the leftward task-relevant sensory discrepancy environment. Statistically significant differences between the conditions were tested with Tukey's HSD post hoc test (**P < 0.005; ***P < 0.001). C: mean (solid line) ± SE (shaded region) muscle activity in the pectoralis major (top) and posterior deltoid (bottom) for perturbations in the normal (left) and rightward task-relevant sensory discrepancy (right) environments. D: mean ± SD muscular response over the involuntary interval for the rightward task-relevant sensory discrepancy environment. ***P < 0.001.

