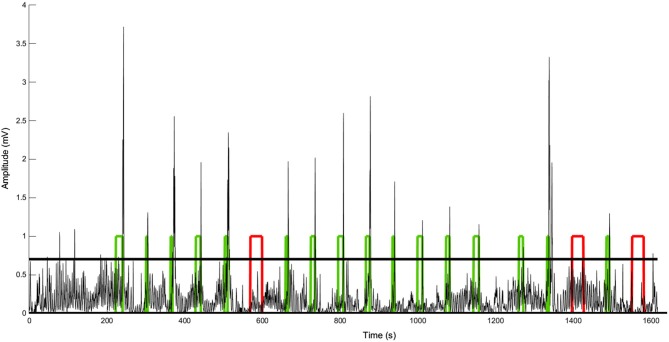
Figure 1.
Respiration amplitude changes over time for patient MCS-1. The horizontal bold line represents the threshold (mean + 1.5 SD of 5 min baseline recording). The square waves represent the periods of music presentation (acoustic guitar playing). The patient was instructed to breathe deeply (i.e., sniff) as soon as the music was presented. When this command was successfully performed (green blocks) the patient received a positive auditory feedback (i.e., the music stopped and applause was presented). Otherwise, the music continued for 30 s (red blocks) and a negative feedback was given (white noise). Note that a response to command (i.e., sniff) was observed in 16 out of the 19 trials.

