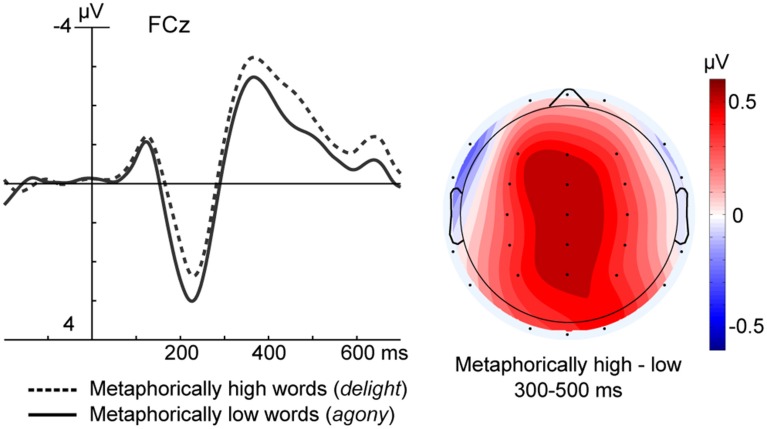
Figure 3.
The left panel shows ERP data at a fronto-central electrode for the Metaphorically high (i.e., positively valenced) and Metaphorically low (i.e., negatively valenced) conditions collapsed across movement direction. The right panel depicts a topographic scalp map of the mean amplitude voltage difference for the Metaphorical verticality conditions in the 300–500 ms time window.

