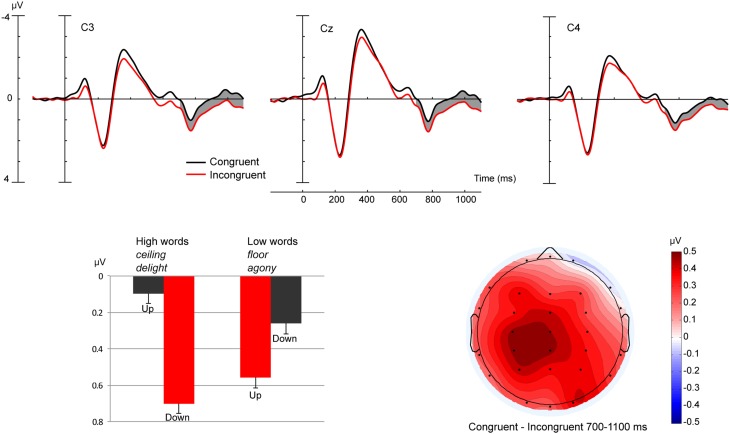
Figure 5.
The top three panels show ERP data at three central electrodes for participants using their left hand. ERP traces are shown for Congruent and Incongruent conditions collapsed across Lit/Met. The bottom left panel shows a bar graph of ERP mean amplitudes averaged across all electrodes in the 700–1100 ms time window. Error bars indicate SEM. The bottom right panel depicts a topographic scalp map of the mean amplitude voltage difference for the collapsed Lit/Met conditions for participants using their left hand.

