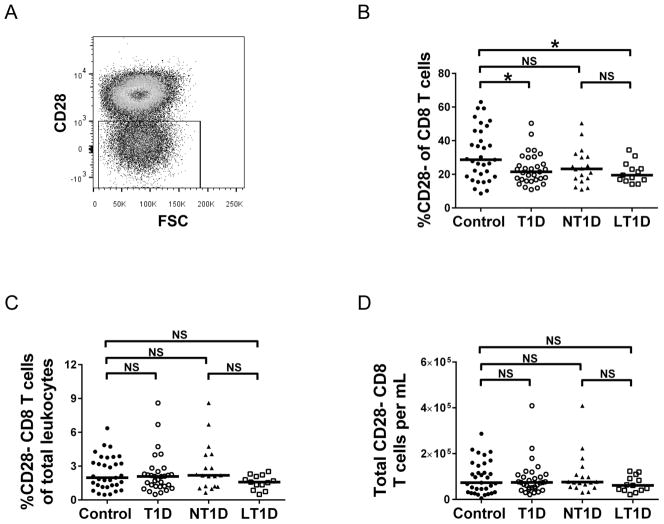
Figure 1. CD28− CD8+ T cells are significantly reduced in proportion of CD8 T cells among diabetics.
(A) Representative scatter plot depicting gating of CD28− CD8+ T cells. CD8+ T cells were first selected as described in the Methods section. (B) Percentage CD28− T cells of CD8+ T cells. (C) Percent CD28− CD8+ T cells of total leukocytes. (D). Total CD28− CD8+ T cells per ml. Statistical analysis was performed using the Mann-Whitney U-test; *p<0.05; NS=not significant. T1D=Type 1 Diabetes. NT1D=new-onset T1D. LT1D=long-standing T1D.

