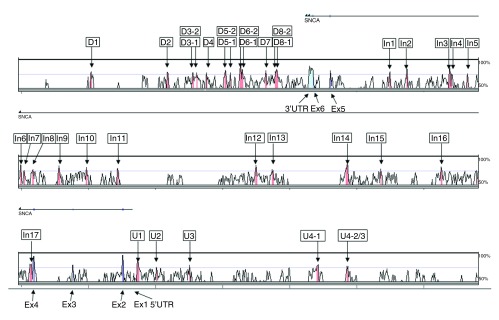
Figure 1. Vista plot from the SNCA region on chromosome 4q21.

Panel shows human-mouse pair-wise comparison of Human genome May 2004 and Mouse Sept. 2005. Pink marked peaks represent ncECRs, turquoise marked peak represent the untranslated region (UTR) of SNCA, blue marked peaks represent exons. D1-D10 are conserved regions downstream of SNCA. In1-In17 are intragenic conserved regions, and U1-U4-2/3 are upstream of SNCA. The black arrow on top shows the transcription orientation.
