
Fig. 4.
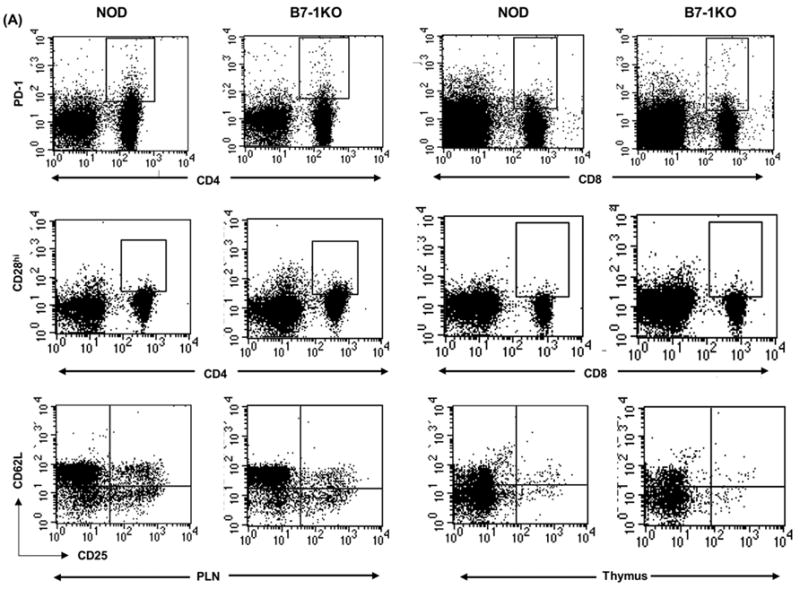
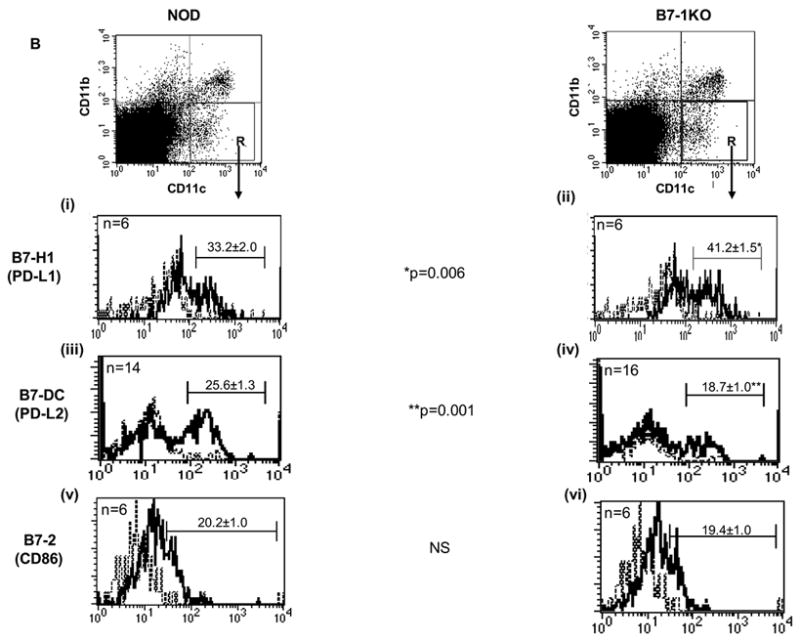
Immunophenotypic characterization of T cell and APCs in B7-1KO versus NOD mice. A: This is the dot plot representation of data described in table 2. The thymic and PLN T-reg dot plots are gated on CD3+CD4+ and CD4+ T cells respectively. B: PLN cells from 5 to 8 weeks old NOD and B7-1KO mice were stained to determine the costimulatory expression profiles of B7-H1 (i and ii), B7-DC (iii and iv), and B7-2 (v and vi). The dot plots are a typical representation of CD11b and CD11c distribution profile in NOD and B7-1KO mice. The histograms are gated on the cells depicted by region R in the dot plot and are described as CD11c+ cells in the text. The dotted lines in the histograms represent the isotype control staining and solid lines represent the actual staining for the corresponding marker. The data are pooled from 2-4 independent experiments. Values represent mean percentage± SEM. NS, not significant.