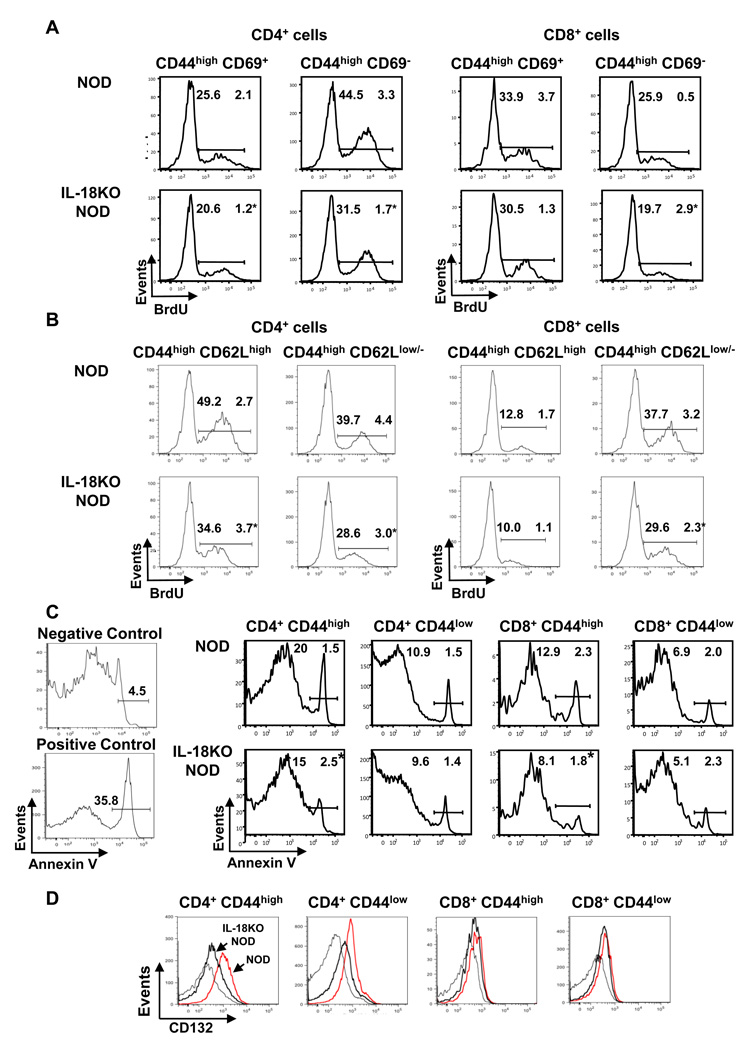
Fig. 6. T cells in the IL-18KO NOD periphery exhibit reduced turnover compared to NOD mice.
(A,B) To identify the proliferating T cell populations by flow cytometry, first the splenic CD4+ and CD8+ populations and then the CD44high CD69+ and CD44high CD69− populations (A) and the CD44high CD62Lhigh and CD44high CD62Llow/− cells were gated (B). The histograms show the percentages of BrdU+ cells within these populations in NOD and IL-18KO NOD mice. These data are representative of 4 mice/strain and were repeated twice with similar results. (C) Comparison of apoptosis in NOD and IL-18KO NOD splenic T cell populations was performed by gating on the 7-AAD− (live) cells and analyzing the percentages of annexin V+ cells. NOD thymocytes and NOD panLN-derived cells served as positive and negative control samples, respectively, for annexin V staining. These results are representative of 4 mice/group and are representative of three independent experiments. (D) Analysis of CD132 expression on the indicated splenocyte populations from NOD (red lines) and IL-18KO NOD (thick black lines) mice relative to isotype control staining (thin black lines). These results are representative of 8 mice/group. (*) denotes a statistically significant difference between NOD and IL-18KO NOD mice for the indicated population.

