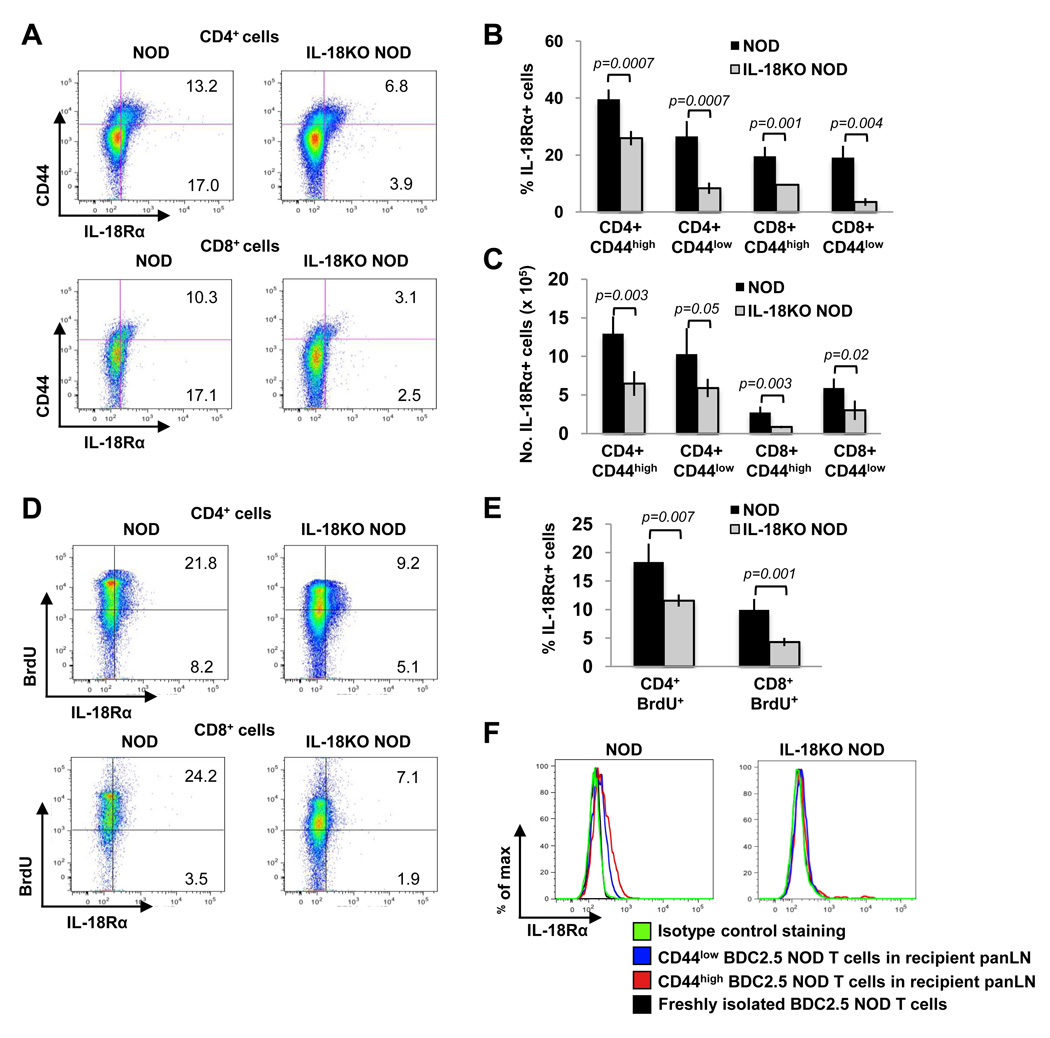
Fig. 9. IL-18Rα is upregulated on activated and proliferating T cells in IL-18-expressing NOD mice.
(A) Flow cytometry delineating the percentages of CD44high IL-18Rα+ cells (upper right quadrants) and the CD44low IL-18Rα+ cells (lower right quadrants) in NOD and IL-18KO NOD mice. (B, C) Summary of the percentages (B) and absolute numbers (× 105) (C) of IL-18Rα+ cells in the indicated T cell populations. (D) Flow cytometry to compare the percentages of BrdU+ IL-18Rα+ cells (upper right quadrants) and BrdU− IL-18Rα+ cells (lower right quadrants) in T cells from NOD and IL-18KO NOD mice that were given BrdU in their drinking water for six days. (E) Summary of the percentages of IL-18Rα+ cells in the BrdU+ populations. All of the results presented in (A–E) are representative of 4 mice/group from one of two independent experiments. (F) NOD (n=4) and IL-18KO NOD mice (n=2) were injected with splenocytes from BDC2.5 NOD mice. IL-18Rα expression was analyzed on the CD44low and CD44high donor T cells (Vβ4+ CFSE+ gated) that were present in the panLN three days later. The IL-18Rα levels on donor T cells were compared to those on freshly isolated Vβ4+ CFSE+ cells prior to adoptive transfer. Staining with isotype control Ab on gated CD44high donor T cells is shown.

