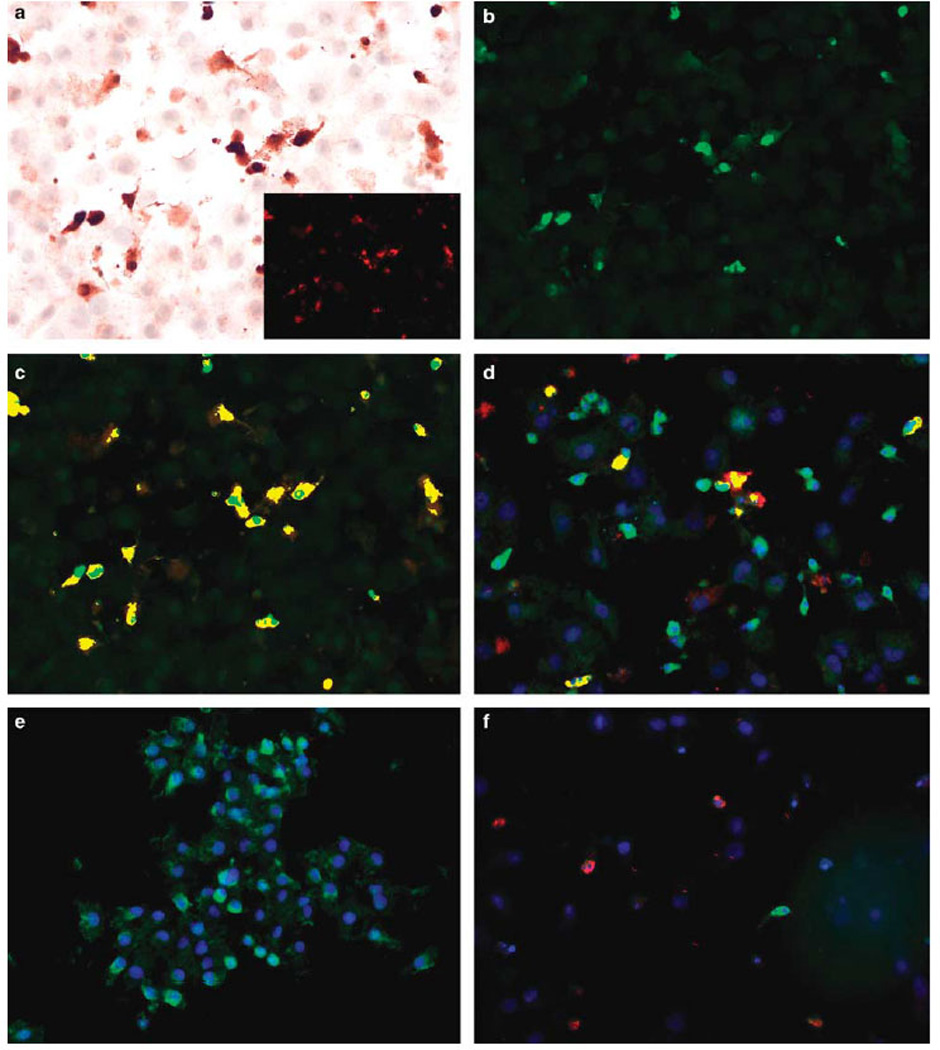
Figure 2.

Molecular correlates of reoviral infection in cell preparations. Co-expression analysis of reovirus (red signal) and caspase-3 (brown signal) (a) in the cell line CAL27 shows that many of the cells with signal show apoptotic changes. The insert shows the Nuance isolated reovirus signal (fluorescent red) while (b) depicts the caspase-3 isolated signal (fluorescent green). When the two signals are merged, basically all cancer cells expressing detectable reoviral protein also express caspase-3 that is evident as fluorescent yellow (c). (d) Shows the merged co-expression analysis of reovirus (fluorescent red) and p38 (fluorescent green); note that most reoviral-positive cells are p38 positive as they show fluorescent yellow. A negative control (no reovirus treatment) shows the p38 signal without any reoviral signal (e). Whereas most reoviral-positive cells expressed p38 (d), Ras, and pERK (data not shown), none of the occasional cells that expressed PKR (fluorescent green, f) co-expressed reovirus (fluorescent red, f).
