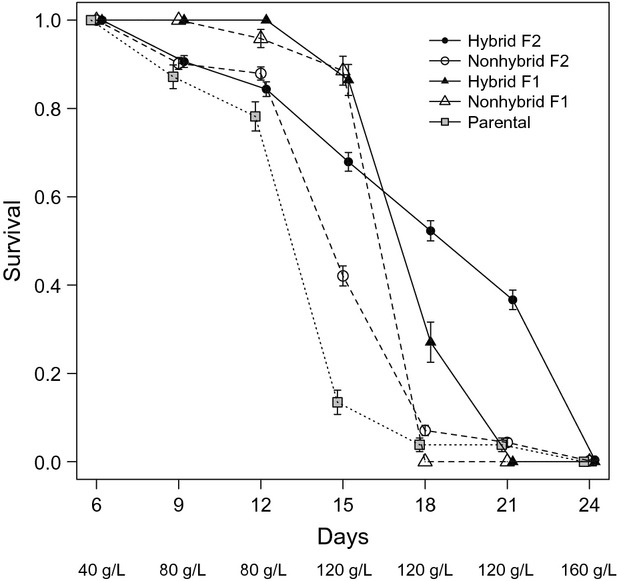
Figure 1.

Mean survival of hybrids and nonhybrids in deteriorating environment. Solid lines with filled symbols represent hybrid populations (those with parents from different species), dashed lines and open symbols represent nonhybrid populations (with parents of the same species), and the dotted line with grey squares represents parental populations. Triangles are the F1 populations; circles are the F2 populations. Error bars are standard errors. The amount of salt in the growth medium is shown below the x-axis.
