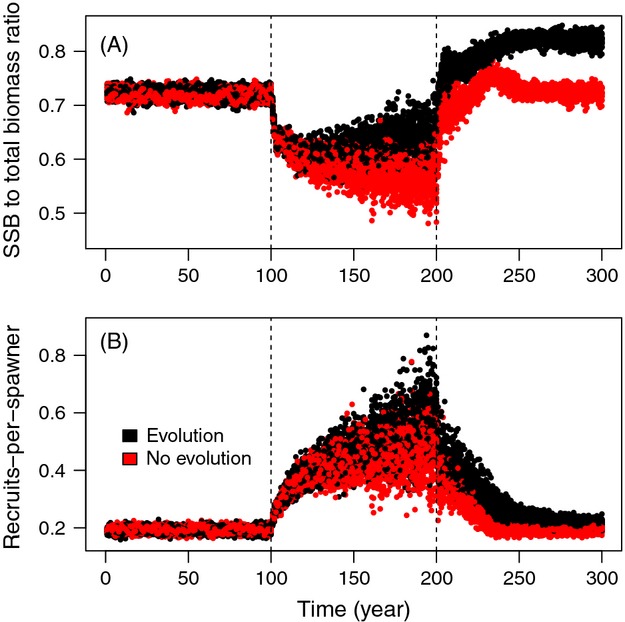
Figure 2.

Temporal development of (A) the proportion of spawning stock biomass (SSB) of the total population biomass and (B) the recruits-per-spawner ratio across the simulation period (300 years). The beginning (year 100) and the end (year 200) of fishing are indicated with dashed vertical lines. Evolutionary and nonevolutionary scenarios are indicated with colours. Values are drawn from 20 replicated simulations for both evolving and nonevolving scenarios.
